Figure 7.
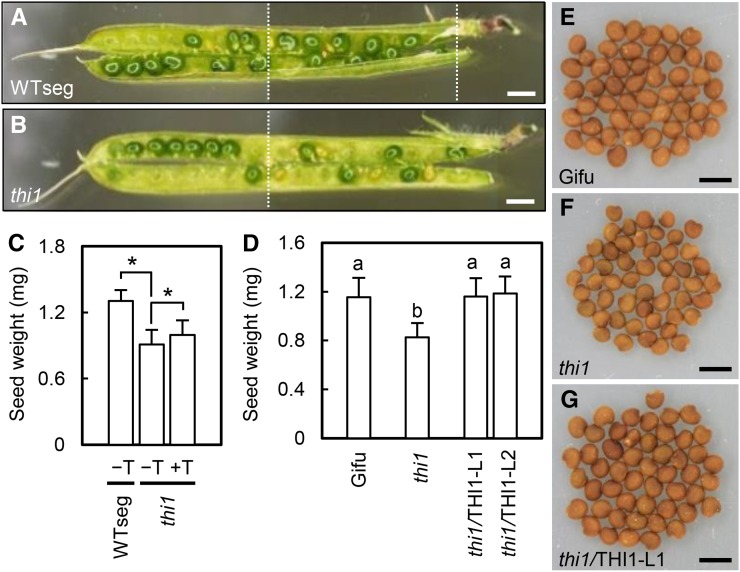
Seed phenotype of the thi1 mutant. A and B, Pods of WTseg and the thi1 mutant. The images were assembled from partial images (the borders are indicated by dotted lines). Bars = 2 mm. C, Dry weight per seed of WTseg and the thi1 mutant with (+T) or without (−T) thiamine treatment at 50 mg L−1. Error bars indicate sd (n = 15–20). Significant differences are shown (Student’s t test: *, P < 0.05). D, Dry weight per seed of control plants (wild-type Gifu and thi1 mutant) and THI1-complemented plants (thi1/THI1). Error bars indicate sd (n = 20). Different lowercase letters show significant differences in the Tukey-Kramer test (P < 0.05). E to G, Seeds of wild-type Gifu (E), the thi1 mutant (F), and thi1/THI1 (G). Bars = 2 mm.

