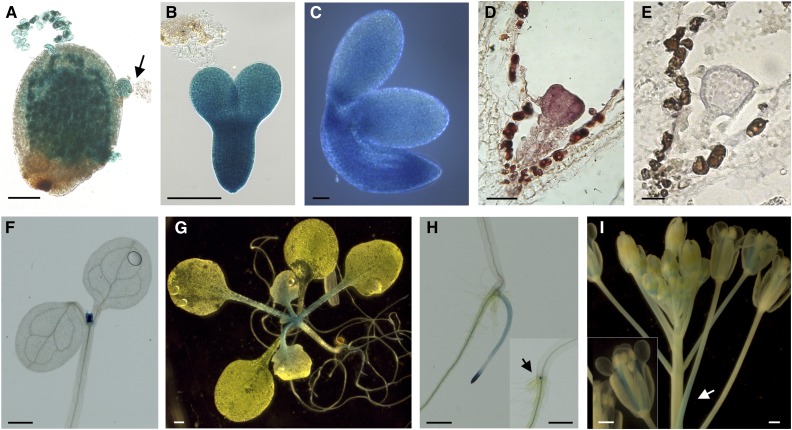
Figure 4.
Expression analysis of TWS1. A to E, Expression analysis of TWS1 expression in developing seeds. A to C, TWS1 promoter-driven GUS activity in a seed carrying an embryo at the globular stage (arrow; A), an isolated embryo at the torpedo stage (B), and an isolated mature embryo (C). Scale bars = 50 µm. D and E, TWS1 mRNA expression pattern in a triangular stage embryo (D) and control hybridization with a TWS1 sense probe (E). Scale bars = 20 µm. F to I, Expression analysis of TWS1 expression in vegetative and reproductive tissues. TWS1 promoter-driven GUS activity in 7-d-old seedling above ground tissues (F), 2-week-old whole plant (G), 7-d-old seedling roots (H), and inflorescence (I). Scale bars = 500 µm.

