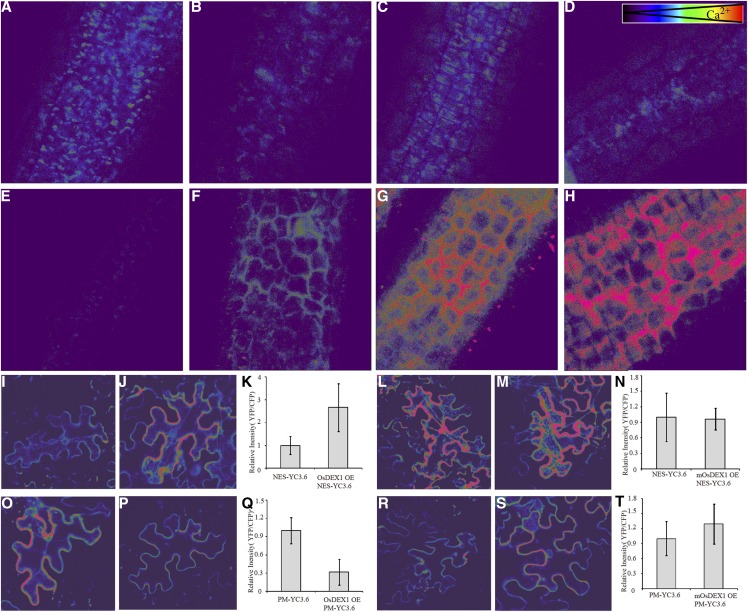
Figure 9.
The Ca2+ concentration calculated by emission ratios between YFP and CFP intensities using confocal laser scanning microscope in rice anthers and tobacco epidermal cells. A to H, Ca2+ concentration on plasma membrane in tapetal cells of wild type (A–D) and osdex1 (E and F) from stage 8 to stage 11. I to T, Comparison of cytosolic (I to N) and plasma membrane (O–T) Ca2+ concentration in tobacco epidermal cells overexpressed with OsDEX1 (J and P) or mOsDEX1 (M and S). I, L, O, and R, Control of YC3.6 overexpression. K, N, Q, and T, Statistical analysis of ratios between YFP and CFP intensities in the cells (K and N) and on the plasma membrane (Q and T).

