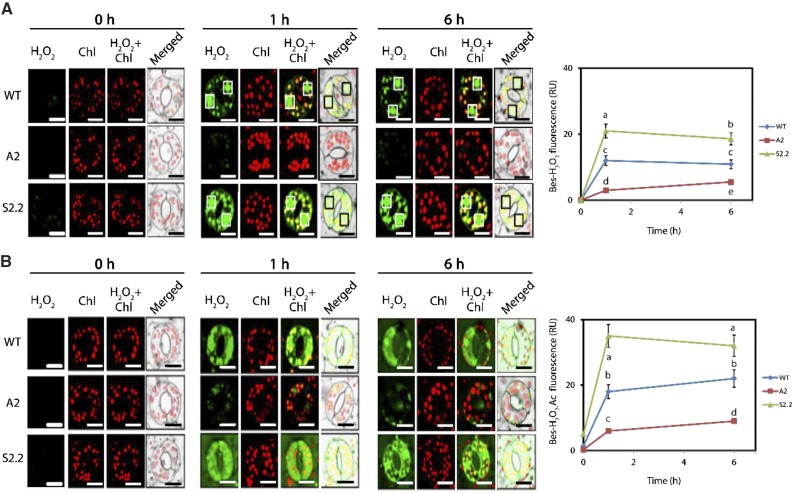
Figure 3.
Intracellular/extracellular H2O2 in guard cells of wild-type (WT), A2, and S2.2 plants post-NaCl treatment. A, Representative CLSM images of intracellular BES-H2O2-Ac fluorescence (green) and chlorophyll (Chl) autofluorescence (red) at 0, 1, and 6 h post-NaCl treatment. White boxes (black in merged images) denote nuclei. Images are representative of three independent experiments with six micrographs per genotype in each time point. Quantification of green signal is shown at right. Bars = 20 μm. B, CLSM images of intercellular BES-H2O2 fluorescence (green) and chlorophyll autofluorescence (red) at 0, 1, and 6 h post-NaCl treatment. White boxes (black in merged images) denote nuclei. Images are representative of three independent experiments with six micrographs per genotype in each time point. Quantification of green signal is shown at right. Bars = 20 μm. Data in charts at right are means ± se of three independent experiments with three technical replicates each. Different letters indicate significant differences of Duncan’s multiple comparisons (P < 0.05). RU, Relative units.

