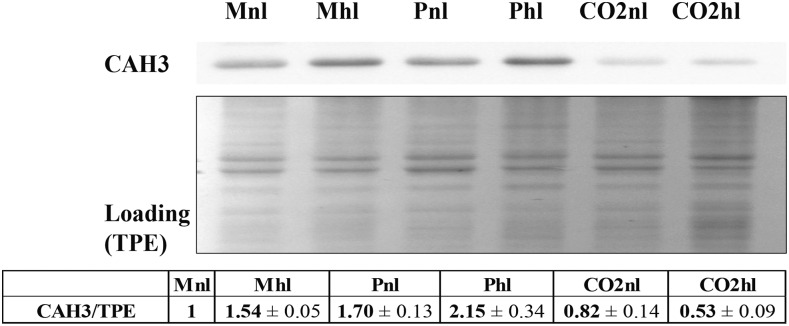
Figure 2.
Expression of CAH3. CAH3 expression was determined on total protein extract (TPE) from cells. Ten micrograms of proteins was loaded in each well. For quantitative densitometry analysis, CAH3 signal was normalized to total protein loading to correct for possible loading errors. For digital analysis, Gel-Pro software was used. The quantitative data were obtained from a minimum of two biological replicates and three technical repetitions.

