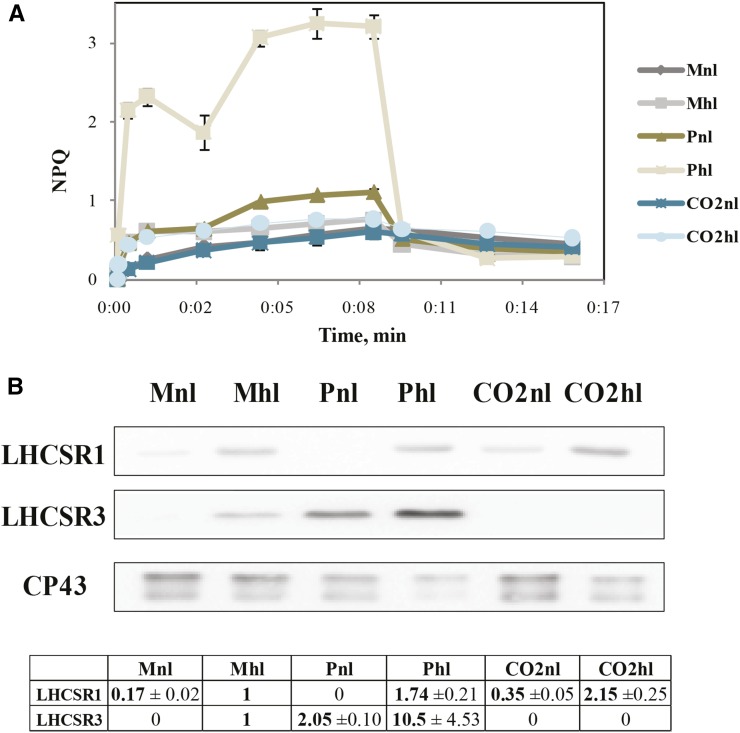
Figure 7.
Changes in C. reinhardtii NPQ capacity upon different acclimations. A, NPQ measured on a Dual PAM-100. B, Immunoblot detection of LHCSR1, LHCSR3, and CP43. Ten micrograms per well of total protein extract from different cell samples was loaded. For digital analysis, Gel-Pro software was used. In the table, LHCSR1/CP43 and LHCSR3/CP43 estimations are presented.

