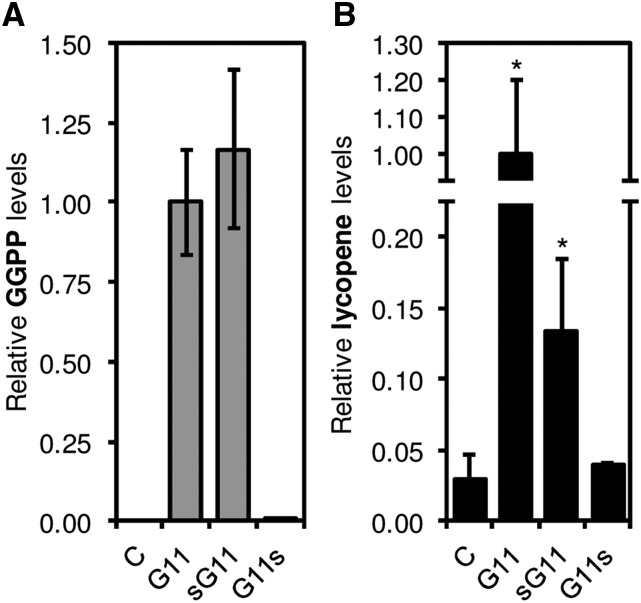
Figure 3.
GGPPS activity assays. A, In vitro assays. Protein extracts from E. coli cells overproducing similar amounts of the indicated proteins or transformed with an empty vector (C) were mixed with IPP and DMAPP, and the production of GGPP was quantified by LC-MS. Levels are represented relative to those in G11 samples. Mean and sd of n = 3 extracts are shown. No GGPP was detected in C samples, and only traces were identified in G11s extracts. B, In vivo assays. Bacterial cells were cotransformed with pACCRT-BI (which lacks a functional GGPPS-encoding gene to produce lycopene) together with a plasmid expressing the indicated G11 isoform or an empty vector (C). Positive transformants were used to measure lycopene levels by normalizing A472 to bacterial growth (OD 600 nm). Levels are represented relative to those in G11 samples. Data correspond to the mean and sd of n = 10 independent transformants. Asterisks mark statistically significant differences from the C control (P < 0.05, one-tailed Student’s t test assuming equal variances).

