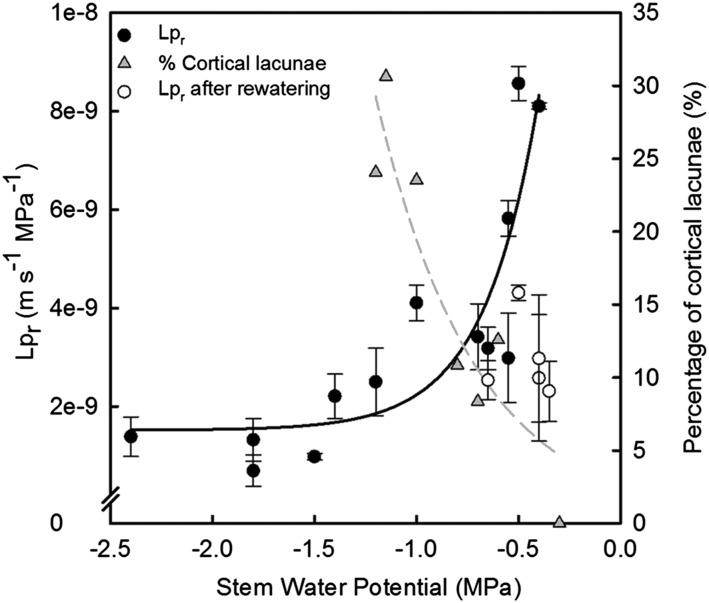
Figure 5.
Drought-induced changes in Lpr and percentage area covered by cortical lacunae (of total cortical area) in grapevine fine roots as a function of stem water potential. Each gray triangle symbol represents a single root analyzed (dashed gray line is best fit,  ,
,  , P = 0.0035). Lpr was measured on roots obtained from plants subjected to drought at different Ψstem (solid line is best fit,
  ,
,  , P < 0.0001). To evaluate the ability to recover Lpr following drought, Lpr was determined from rewatered plants. (i.e. in the region of Ψstem between −1.0 and −2.0 MPa) that recovered for 1 day after watering. Each circle represents mean ± se (n = 3 roots).

