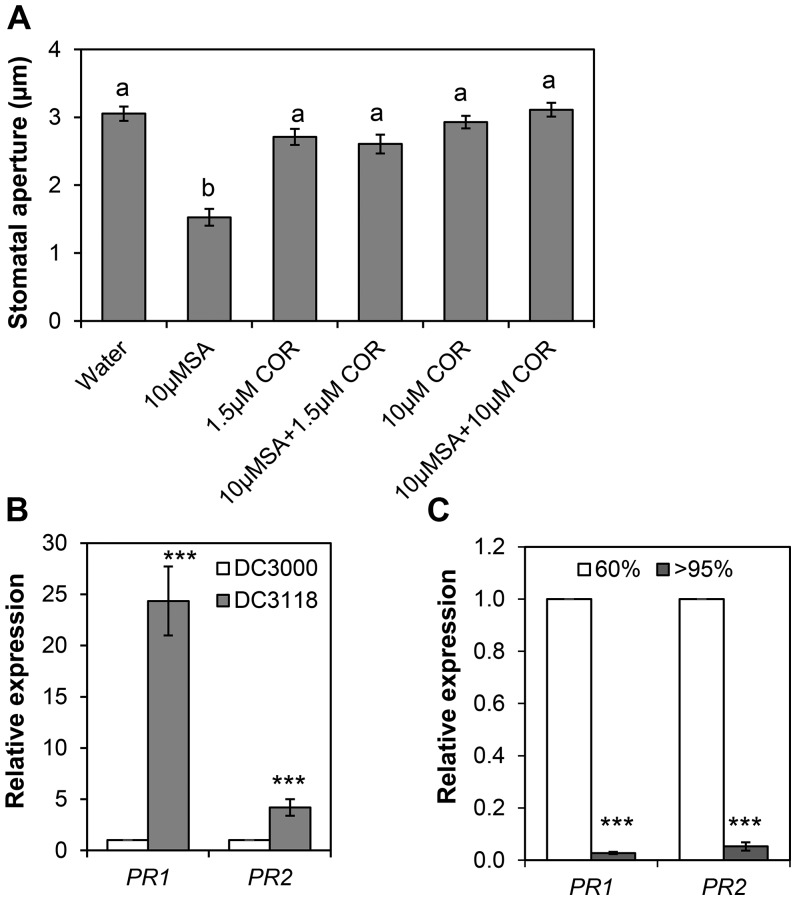
Figure 6.
High RH represses bacterium-induced SA-responsive genes in guard cells. A, Stomatal aperture width in intact leaves 2 h after exposure to the indicated chemicals. Data points are average (n > 60) ± se, and different letters above the bars indicate statistical significance (P < 0.05) calculated with ANOVA. B, Relative expression of the PR1 and PR2 genes in guard cells of Col-0 plants at 1 h after dip inoculation with either Pst DC3000 or Pst DC3118 under 60% RH. Relative expression was calculated based on the expression levels of Pst DC3000-inoculated plants (white bars), which was considered 1. C, Relative expression of the PR1 and PR2 genes in guard cells of Col-0 plants at 1 h after dip inoculation with Pst DC3118 under 60% or >95% RH. Relative expression was calculated based on the expression levels of plants kept under 60% RH (white bars), which was considered 1. For graphs showing gene expression (B and C), data points are average (n = 3) ± se. The asterisks above the bars indicate statistical significance between the means represented by adjacent bars calculated with the Student’s t test (***P < 0.001). Significant means above 1 are considered up-regulation, and significant means below 1 are considered down-regulation. Note that error bars for some data points are very small and do not appear in the graph.

