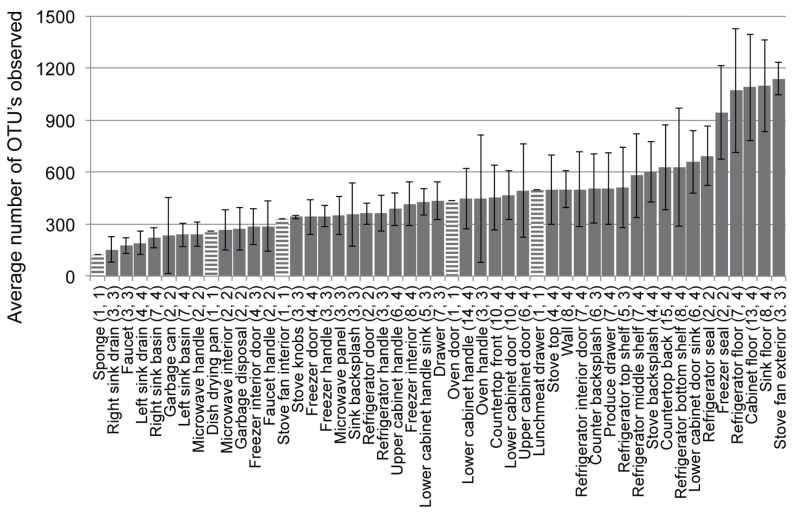
Figure 3.
Average number of bacterial OTUs observed on different residential kitchen surfaces determined from 10,000 randomly selected sequences from each sample. Bars are ordered from least to most diverse. Numbers in parentheses indicate the total number of samples characterized and the number of homes from which samples originated. Error bars are ± one standard deviation. Striped bars are surfaces for which only one sample yielded quality sequence data and thus, do not have error bars.

