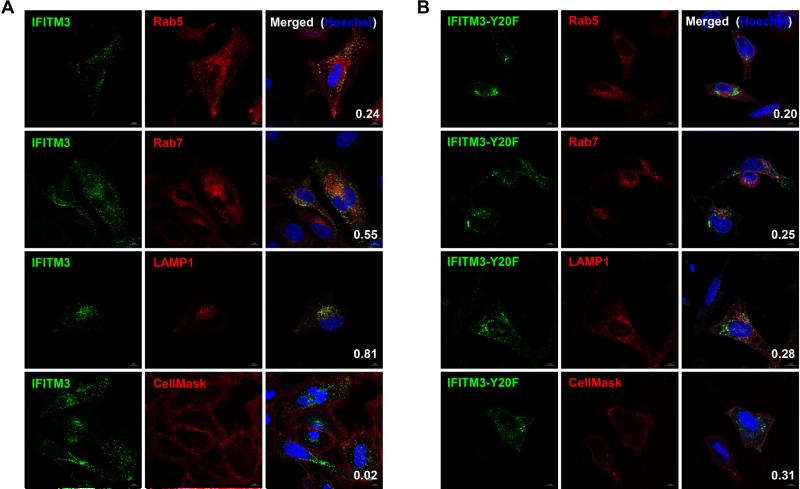
Figure 6.
Live cell bioorthogonal fluorescence imaging of HA-IFITM3-F8UAA localization with H-Tz-BODIPY-FL. Hela cells were transfected with (A) HA-IFITM3-F8TAG or (B) HA-IFITM3-F8TAG-Y20F and mCherry-tagged endocytic markers in the presence of 2’-aTCOK (50 μM), labeled with H-Tz-BODIPY-FL (250 nM, 0.5 h) under physiological conditions, briefly washed, and directly analyzed with confocal microscopy. Rab5, Rab7, LAMP1, and CellMask were used as early endosome, later endo-some, lysosome, and plasma membrane markers, respectively. For plasma membrane staining, cells were transfected only with IFITM3 plasmids, labeled, and stained with CellMask before imaging. Hoechst (blue) was used to stain nuclei. Pearson's correlation coefficients were shown in the merged images to evaluate the co-localization of IFITM3 (green) with markers (red). 10-20 cells were used to calculate Pearson's correlation coefficients for each sample. Scale bars = 10 μm.

