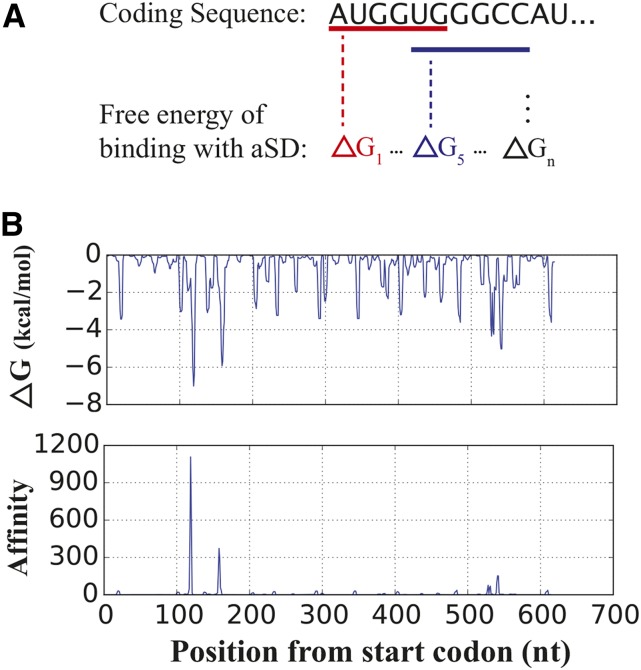
Figure 2.
Quantifying aSD sequence binding within coding regions. (A) We estimate the free energy of binding for each hexamer within a gene to the core aSD (anti-Shine-Dalgarno) sequence (5′-CCUCCU-3′). (B) Free energy (top) and affinity (bottom) profiles for a typical E. coli gene (b3055). The affinity profile amplifies the contribution from strongly binding regions within the gene. nt, nucleotides.

