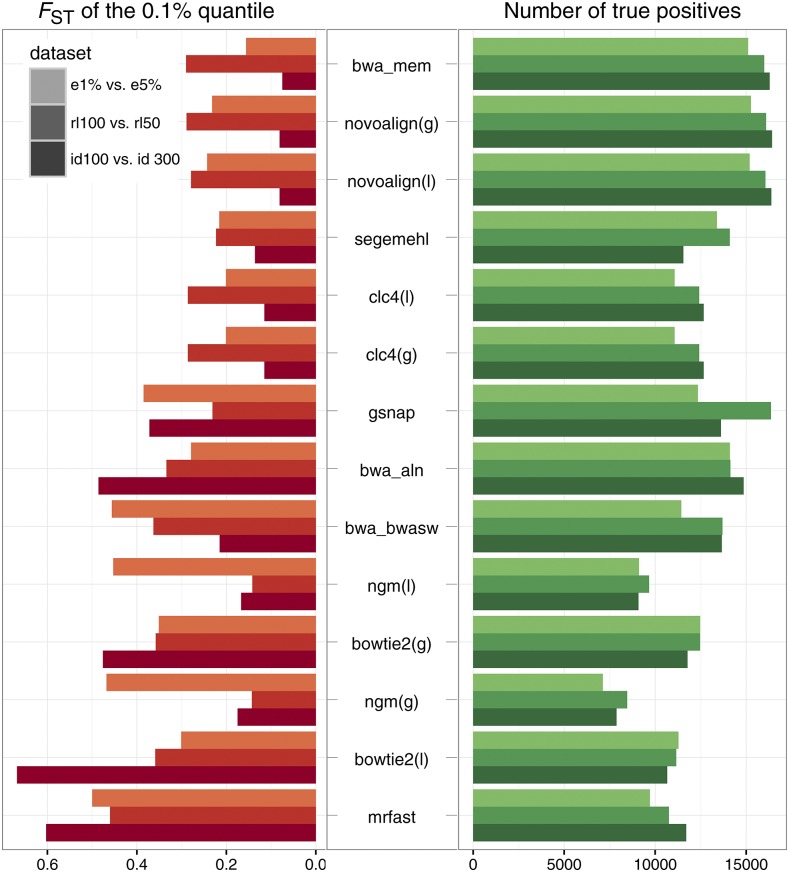
Figure 4.
Comparison of allele frequency differences between simulated Pool-Seq data sets with different mapping algorithms. We simulated different paired end Pool-Seq libraries, mapped the reads, and compared the allele frequencies between the libraries using With this procedure, we evaluated the sensitivity of the alignment algorithm to differences in the distance between paired ends (id), differences in the read length (rl), and differences in the error rates (e). As all libraries were derived from identical template sequences (templates with SNPs and indels), no significant allele frequency differences were expected (). We estimated the number of truly positive SNPs for which allele frequencies could be compared (TP), and the lowest -values in the 0.1% quantile with the most differentiated SNPs. Algorithms are sorted according to performance, with the best performing algorithm shown at the top (maximizing the true positives, and minimizing the in the outlier quantile). id100, rl100, e1%: 2 × 100 bp paired ends, insert size bp, error rate 1%; id300: 2 × 100 bp paired ends, insert size bp, error rate 1%; rl50: 2 × 50 bp paired ends, insert size bp, error rate 1%; e5%: 2 × 100 bp paired ends, insert size bp, error rate 5%.

