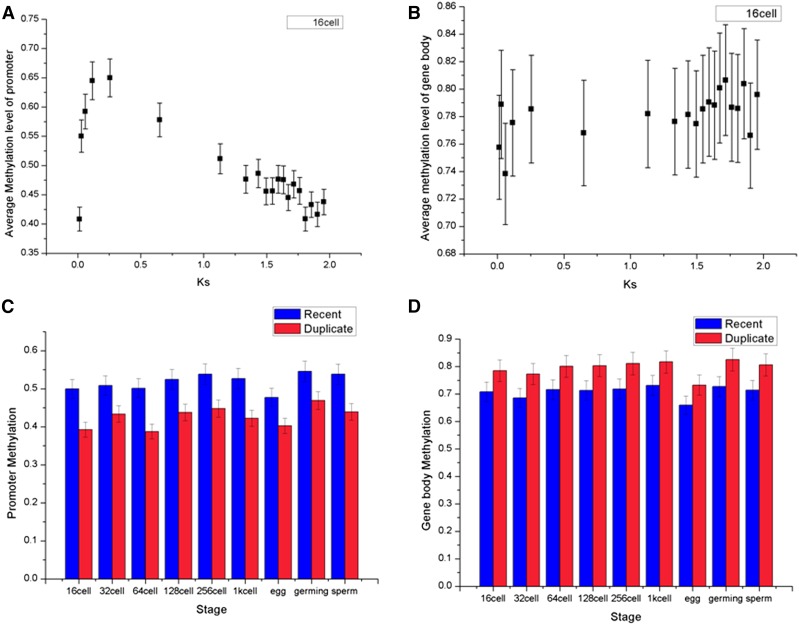
Figure 3.
Patterns of relationship between DNA methylation and evolutionary age (Ks). DNA methylation data from the 16-cell stage are divided into 20 groups by Ks. (A) The correlation between the average promoter methylation level and Ks for duplicate gene pairs (Pearson’s R = −0.72, P < 5.46E−04). (B) Gene body methylation shows a positive correlation with Ks than does promoter methylation (Pearson’s R = 0.58, P = 7.53E−03). Error bars represent 95% confidence intervals. (C) “Recent” duplicate pairs were single copy in grass carp but duplicates in zebrafish (n = 85), which is relative younger than remaining duplicate pairs. Duplicates are significantly (P < 0.05) less methylated than young duplicates in promoters. (D) Duplicates are more methylated than young duplicates in gene body.

