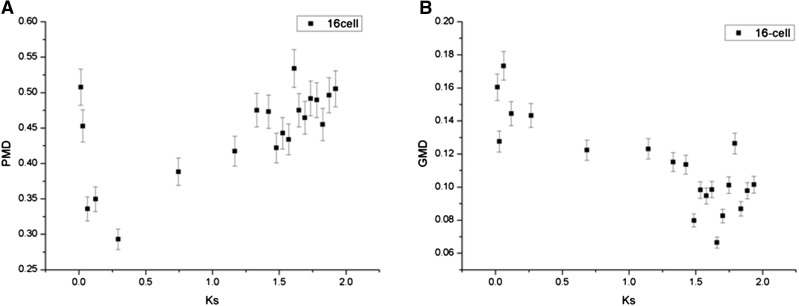
Figure 5.
The relationship between methylation divergence and Ks. (A) PMD and Ks are positively correlated (Pearson’s R = 0.61, adjusted P value < 4.65E−03). Compared with older duplicate gene pairs, the younger pairs tended to exhibit similar levels of promoter methylation. (B) Significantly negative correlation is found between the GMD and Ks (16-cell, Pearson’s R = −0.82, adjusted P value < 4.65E−03).

