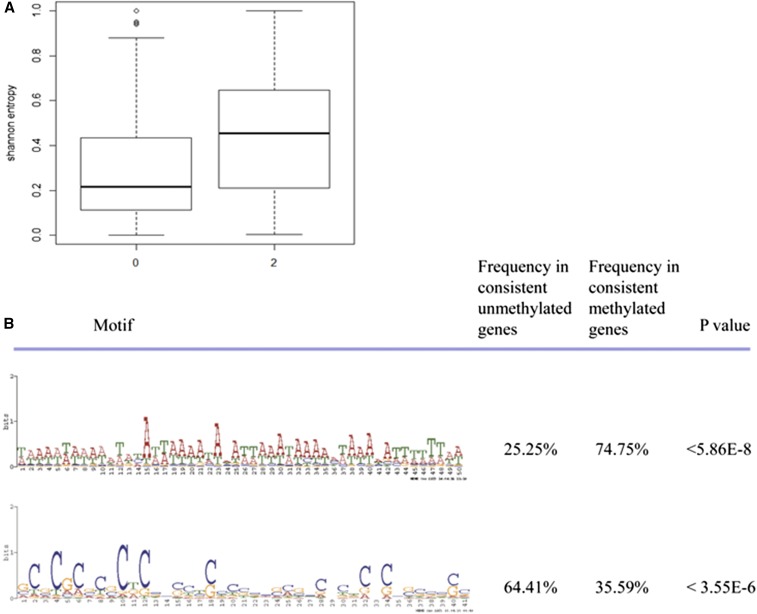
Figure 7.
Shannon entropy and motifs comparison between promoter-methylated genes and promoter-unmethylated genes. (A) Promoter-unmethylated genes exhibited significantly lower Shannon entropy. (B) One motif occurred significantly more often in the unmethylated group than in the methylated groups (P < 5.86E−8, Fisher’s exact test), whereas another motif occurred significantly less often (P < 3.55E−6, Fisher’s exact test).

