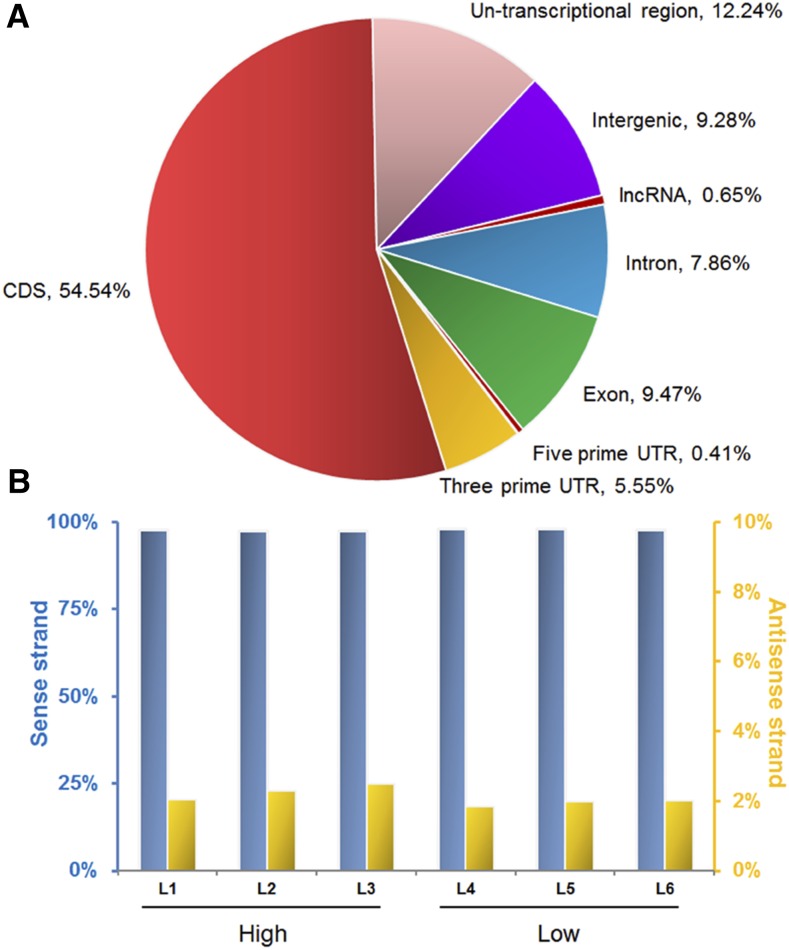
Figure 1.
Annotation of the uniquely mapped reads of RNA-seq in liver tissue of pigs. (A) Distribution of uniquely mapped reads in the pig genome. The percentages in this pie chart represent the mean of all six RNA-seq data. On average, over 50% uniquely mapped reads were located in the CDS region. The untranscriptional regions were defined as genome region of annotated genes but without coverage of annotated transcripts. (B) Reads distributed on the sense and antisense strands of annotated genes. Approximately 2% reads were mapped on antisense strands of annotated genes.

