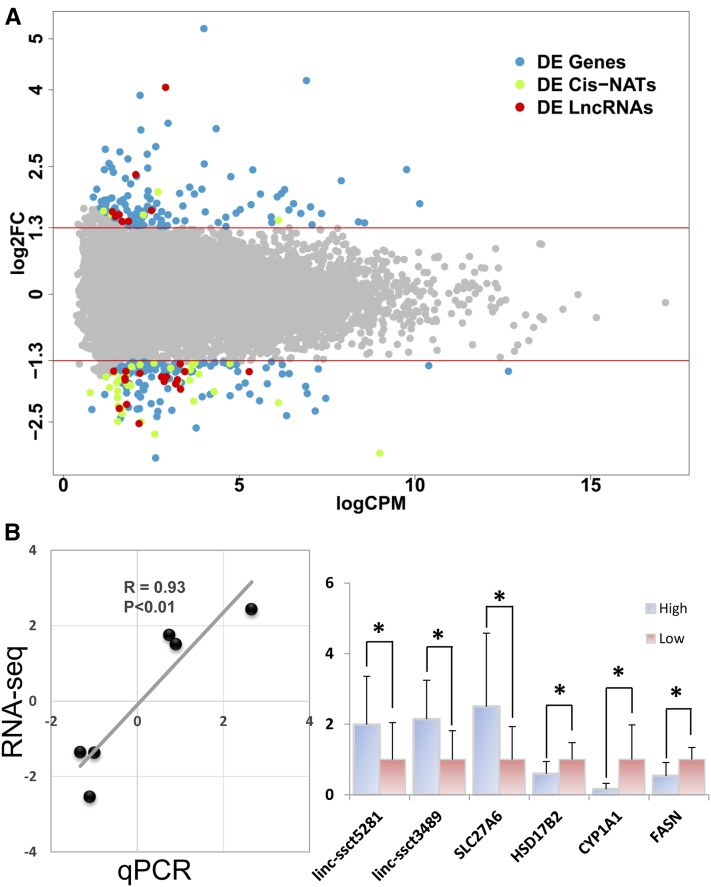
Figure 3.
DE transcripts between low- and high-FCR pigs. (A) Plot of the DE transcripts with FC ≥ 2.5 and FDR ≤ 0.05. Light blue, light green, and red dots represented the DE annotated genes, cis-NATs and lncRNAs, respectively. The x-axis and y-axis represent the logCPM and log2FC, respectively. (B) qPCR validation of DE transcripts in liver tissue of high-FCR (n = 10) and low-FCR (n = 10) pigs. The left plot is correlation analysis of RNA-seq and qPCR. For right bar plot, qPCR data were represented as mean ± SD; * P < 0.05.

