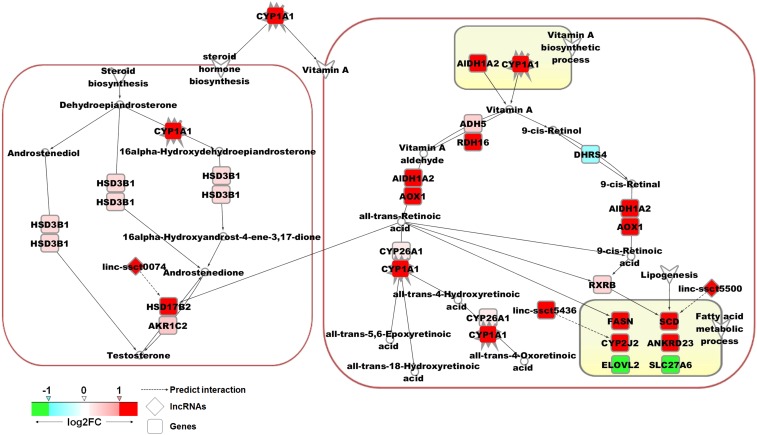
Figure 6.
Potential pathway of the annotated DE genes and lncRNAs in the liver tissues of high and low FCR pigs. Red and pink indicates upregulation in low FCR pigs (red, log2FC > 0.5; pink, 0 < log2FC ≤ 0.5); green and blue indicates downregulation in low FCR pigs (green, log2FC < −0.5; blue, −0.5 ≤ log2FC < 0).

