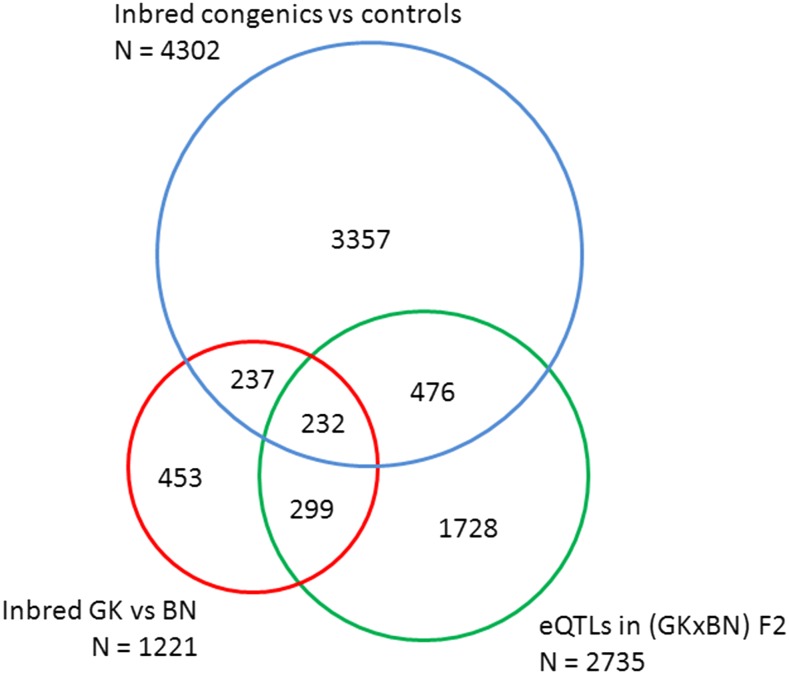
Figure 7.
Summary of transcriptome results among inbred strains and eQTL data in GK × BN F2 hybrids. The number of statistically significant eQTLs (green circle) and differentially expressed genes between GK and BN (red circle) and between congenics and controls (blue circle) are reported. Concordant data between the different experimental groups correspond to genes showing consistent allelic effects on the direction of expression changes.

