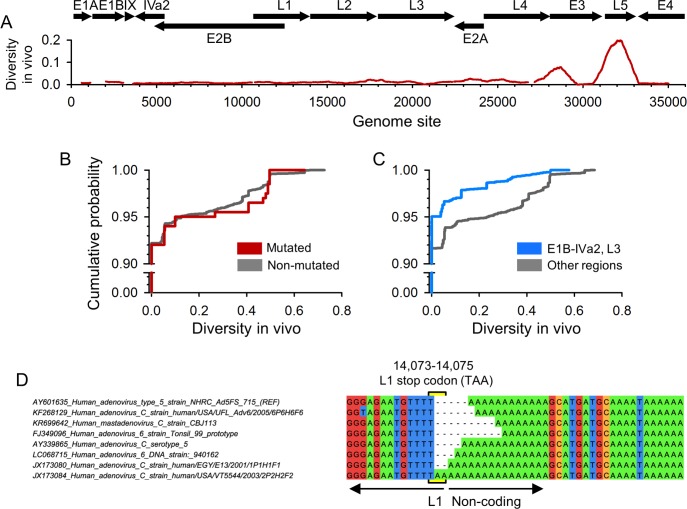
Fig 3. Relationship between mutation rate and the in vivo sequence diversity.
A. Nucleotide diversity along the adenovirus genome. The protein-coding regions of different transcription units are indicated on top with arrows showing their orientation. The red line shows Nei and Li´s nucleotide diversity averaged over a 1 kpb sliding window, using alignments of adenovirus C sequences retrieved from GenBank. Some small discontinuities appear because the analysis was done of a per-gene basis to facilitate sequence alignment. B. Cumulative probability of nucleotide diversity values obtained from GenBank sequences, comparing sites that showed mutations in our experimental system (red) versus non-mutated sites (grey). Notice that the y-axis is broken and that most sites showed no diversity. C. Same figure for the two low-mutation regions (defined in Fig 2B) versus the rest of the viral genome. D. Sequence variants found around genome site 14,073 in GenBank sequences. Accession numbers are included in sequence names. We retrieved 47 adenovirus C sequences in total, but only one example per variant is shown for clarity. Similar figures for other recurrently mutated sites (see Table 2) are provided in S2 Fig.

