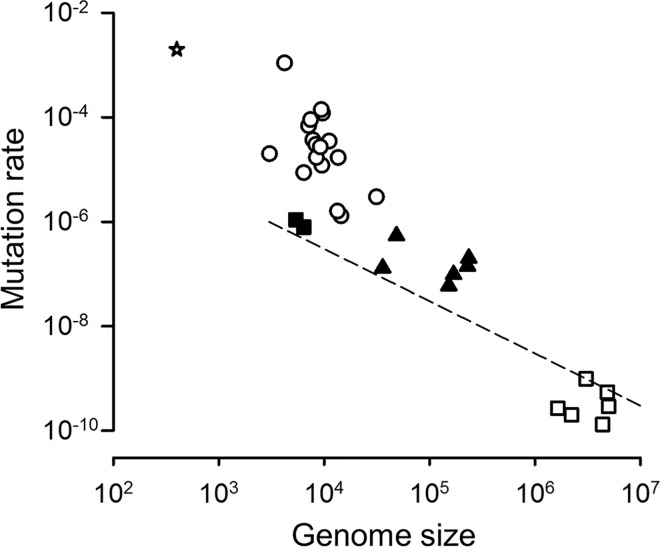
Fig 4. Correlation between genome sizes and mutation rates in viruses.
Published mutation rate estimates are shown for a viroid (star), RNA viruses including retroviruses (white circles), single-stranded DNA viruses (black squares; from left to right: bacteriophage ØX174 and bacteriophage m13), double-stranded DNA viruses (black triangles; from left to right: HAdv5 from this study, bacteriophage λ, herpes simplex virus, bacteriophage T2, murine cytomegalovirus, and human cytomegalovirus). See text for DNA virus mutation rate references. Details on mutation rate data can be found in a recent review [26]. Bacterial and viroid mutation rates were taken from a previous review [7]. The dashed line corresponds to a mutation rate of 0.003 per site.

