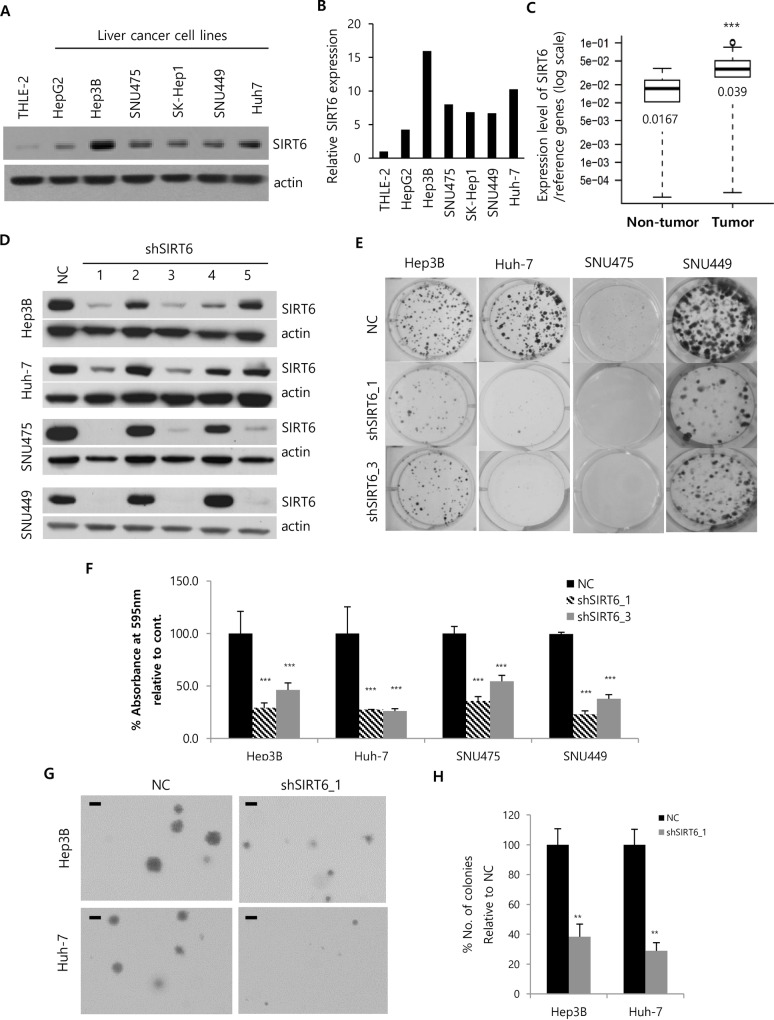
Fig 1. Effects of SIRT6 depletion on HCC cell growth.
(A) The expression of SIRT6 in HCC cell lines and normal liver lysate was assessed by western blotting using actin as a loading control. (B) Band intensities were measured by densitometry using Image J. SIRT6 band intensities were normalized to those of actin. (C) Upregulation of SIRT6 mRNA was assessed in HCC tumors relative to normal adjacent tissues by RT-PCR. (D) Hep3B, Huh-7, SNU475, and SNU449 cells were incubated with lentiviral particles containing plasmids with either negative control (NC) or SIRT6 shRNA. Five different lentiviral particles (C1–C5) targeting different sequences were used to delete the SIRT6 gene. HCC cells were harvested 5 days after viral transduction, followed by western blotting to compare the knockdown efficiency of SIRT6. (E) HCC cells transduced by lentiviral particles were seeded into 6-well plates at a density of 500 cells per well. Transduced HCC cells were selected in the growth medium supplemented with 2 μg/ml of puromycin. Cells were fixed and stained with crystal violet after 15 days. Representative images of plates were obtained using a digital camera. (F) The dye was extracted from stained colonies by 20% acetic acid to quantify the colony-forming ability; the extracted dye was quantified by measuring the absorbance at 595 nm with the percentage of the absorbance being calculated relative to that of NC (100%). (G) Hep3B and Huh-7 cells, transduced by the respective lentiviruses containing NC and shSIRT6, were cultured in soft agar with DMEM for 16 and 19 days, respectively. The representative micrographs were obtained using the iSolution Lite program. (H) Colonies larger than the indicated bar on the colony image were counted. The number of colonies (%) was calculated relative to that of NC, which was set to 100%. All data are representative of three independent experiments. (**P<0.05; ***P<0.001).

