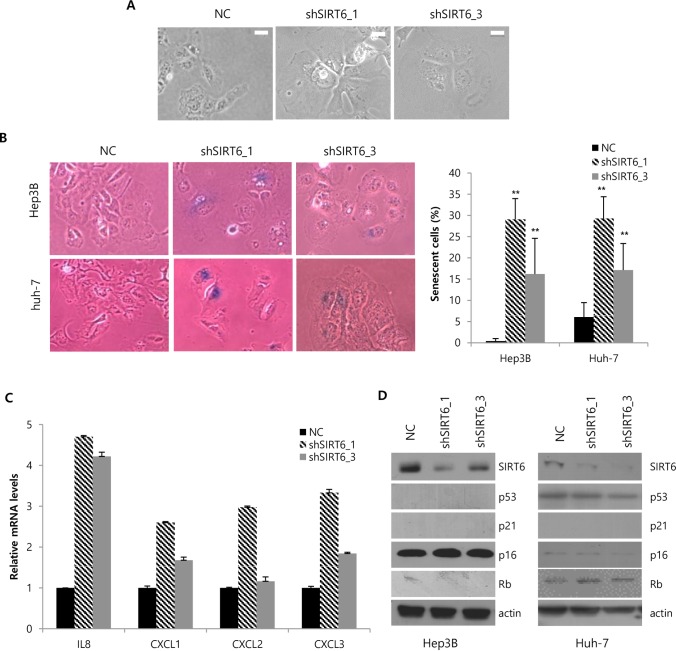
Fig 3.
Induction of cellular senescence by SIRT6 depletion in the p16/Rb and p53/p21- independent manners (A) Representative micrographs of Hep3B cells 6 days after infection with lentiviruses containing NC or shSIRT6. The scale bar indicates 20 μM. (B) Representative micrographs of SA-ß-gal staining in NC and shSIRT6-depleted Hep3B and Huh-7 cells. The percentage of SA-ß-gal-positive cells was quantified from 6 different areas in the plate. (C) mRNA levels of the selected cytokine genes in control and SIRT6-silenced Hep3B cells are indicated in the histogram. (D) The expression of p16, Rb, p53, and p21 was analyzed by western blotting. Three independent experiments were performed. (**P<0.01).

