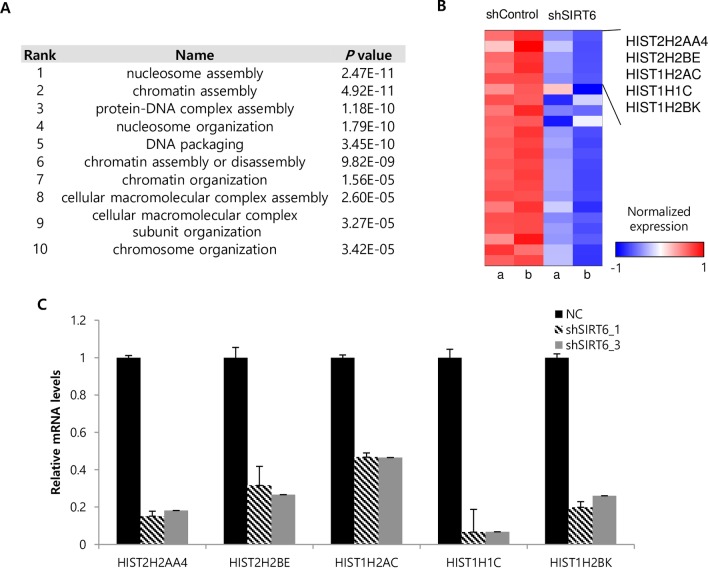
Fig 4. Microarray analysis of SIRT6-depleted Hep3B cells.
(A) Microarray data show statistically significant effects of SIRT6 knockdown on gene expression with the indicated gene ontology. (B) The heat map shows the effect of SIRT6 depletion (from two independent Hep3B cell infections designated as “a” and “b”) on genes that function in nucleosome assembly. (C) mRNA levels of the selected nucleosome assembly genes in control and SIRT6-depleted Hep3B cells are indicated in the histogram. All data are representative of two independent experiments.

