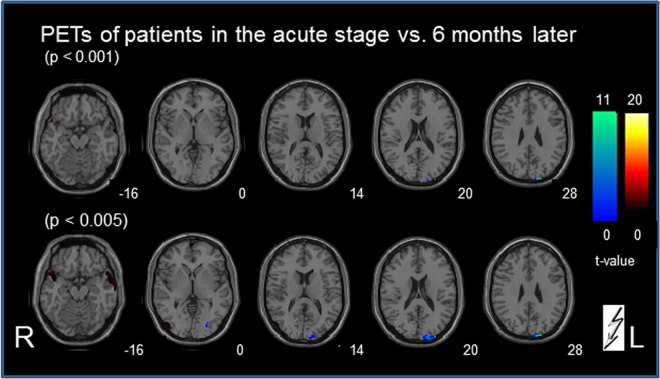
Fig 2. Statistical group subtraction analysis (paired t-test) of the PET scans in patients with vestibular midbrain lesions.
The contrast of the PET scan at the acute stage vs. a second scan 6 months later after recovery (indicated in red) revealed at a threshold of p < 0.001 only small bilateral inferior temporal signal differences that partly merged into the inferior-most insula region bilaterally at a lowered significance level of p < 0.005. The inverse contrast recovery vs. acute stage (indicated in blue) showed at p < 0.001 only one signal cluster in the ipsilesional primary visual cortex that expanded at a lowered significance level (p<0.005). At this lowered significance level one additional ipsilesional lateral visual cluster became evident. No signal changes were seen in the cerebellum or other cortical areas for both contrasts, even at the lowered threshold. The numbers on the bottom right of each slice indicate the z-level of the Talairach space.

