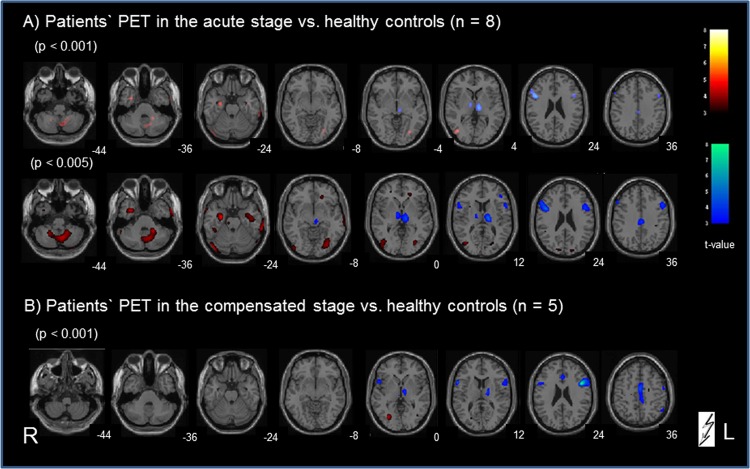
Fig 3. Categorical comparison of PET data in midbrain patients vs. age-matched healthy controls.
A) for the acute stage vs. controls and B) after recovery vs. controls. Significant voxels in the calculation for patients > controls are indicated in red; for the inverse contrast controls > patients are indicated in blue (all p-values are uncorrected). The numbers on the bottom right of each slice indicate the z-level of the Talairach space.

