
Figure 3.
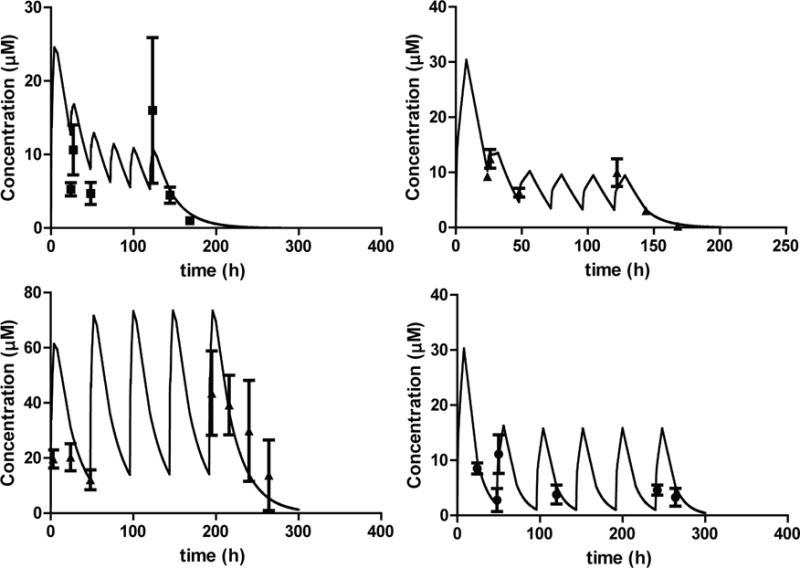
Multiple dose PK studies with compound 32 and 33. The dosing regimens were simulated based on the disposition data following single oral doses to mice (lines) and the observed plasma concentrations (dots) compared to the simulation. (top left panel) 32 was dosed at 20 mg/kg on day 1 and then 5 mg/kg every 24 hours for 5 doses. (bottom left panel) 32 was dosed at 50 mg/kg every 48 hours for 5 doses. (top right panel) 33 was dosed at 20 mg/kg on day 1 and then 5 mg/kg every 24 hours for 5 doses. (bottom right panel) 33 was dosed at 20 mg/kg on day 1 and then 10 mg/kg every 48 hours for 5 doses. Each dot is a mean of 3 mice with standard deviation.