
Figure 5.
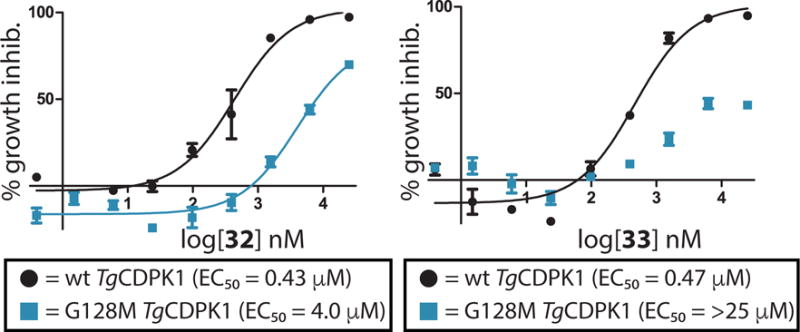
EC50 curves of inhibitors 32 (left) and 33 (right) for T. gondii over-expressing either wild type (wt) TgCDPK1 (black circles) or a drug resistant G128M TgCDPK1 mutant (blue squares). All experiments were performed in triplicate.
Official websites use .gov
A
.gov website belongs to an official
government organization in the United States.
Secure .gov websites use HTTPS
A lock (
) or https:// means you've safely
connected to the .gov website. Share sensitive
information only on official, secure websites.
EC50 curves of inhibitors 32 (left) and 33 (right) for T. gondii over-expressing either wild type (wt) TgCDPK1 (black circles) or a drug resistant G128M TgCDPK1 mutant (blue squares). All experiments were performed in triplicate.