
Figure 8.
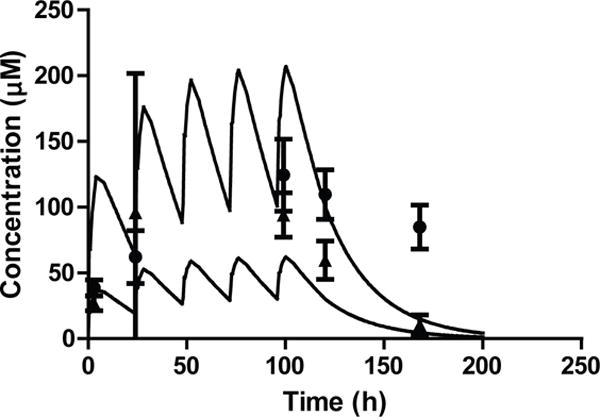
Exposure to compound 32 in multiple dose toxicity studies. The concentration profiles of 32 following 30 mg/kg and 100 mg/kg daily doses were simulated based on the single dose 10 mg/kg data. The mean observed concentrations (n=3) with standard deviation are plotted as triangles for 30 mg/kg dosing and circles for the 100 mg/kg dosing) with the simulation.