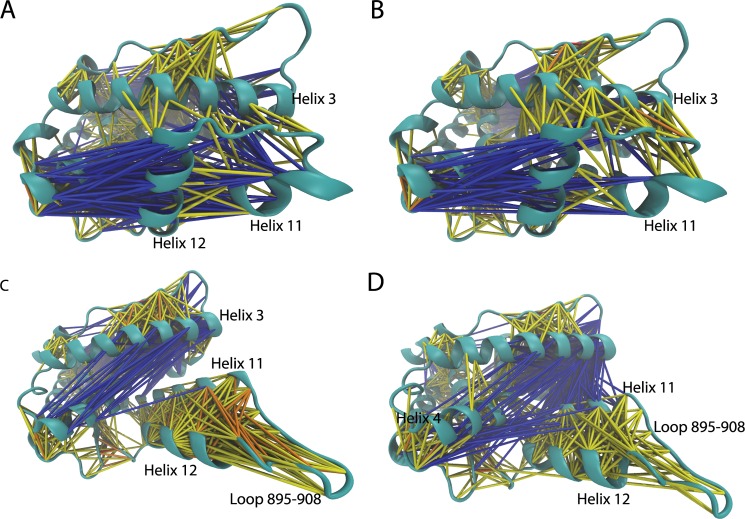
Fig 5.
The overall cross-correlation networks in simulation systems apo-1a28 (A), holo-1a28 (B), apo-2ovh (C) and holo-2ovh (D). If two residues are correlated or anti-correlated, they are linked by lines. Different cross-correlation co-efficiency (ccc) is indicated by color. Anti-correlation is blue (-0.4 < = ccc<0.2), yellow (0.2< = ccc<0.4), orange (0.4< = ccc<0.6) and red (ccc> = 0.6) are used for correlations. The cross-correlation maps of these 4 systems are provided in S2 Fig.

