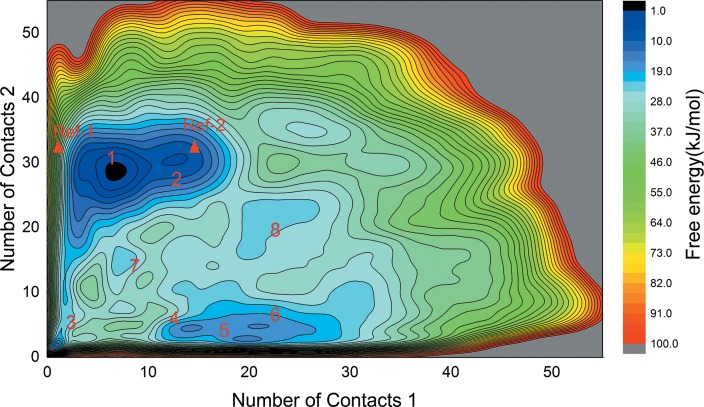
Fig 7. The free energy surface (FES) map constructed by metadynamics simulations.
8 major basins of local minima are labeled together with the positions of two crystal structure models (Ref-1: 2OVH; Ref-2: 1A28) indicated by red triangle marks. The color key at right side of the figure indicates the free energy scales in unit of kJ/mol. The iso-surface lines are given every 10 kJ/mol.

