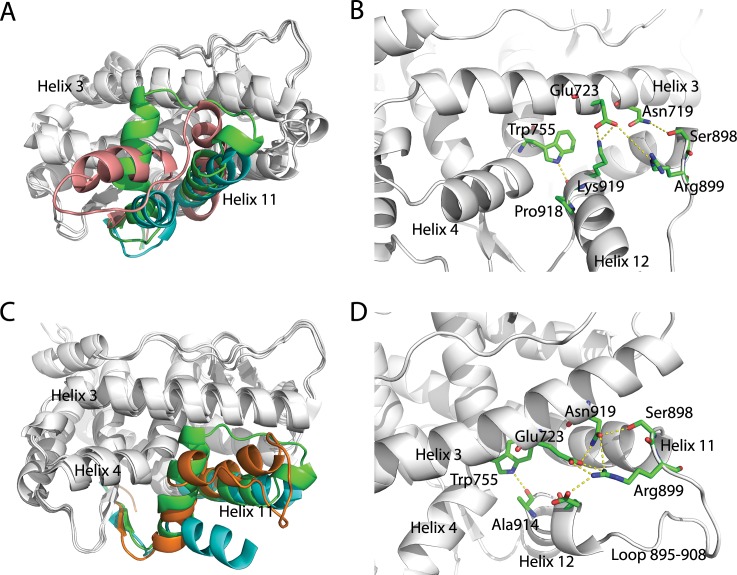
Fig 8. Representiave structures of local minima 1 and 2 sampled in the metadynamics simulation.
(A), the representative structure mL1 (pink) superimposed with crystal agonistic and antagonistic models. (B), the detailed view of interaction networks around the helix 11, loop 895–908 and helix 12. (C), the representative structure mL2.3 superimposed with crystal agonistic and antagonistic models. (D), the detail interaction network between residues in helix-loop-helix segment. The crystal agonistic (PDB ID 1A28) and antagonistic (PDB ID 2OVH) conformations are colored as green and cyan in the helix-loop-helix region. The yellow dashed lines indicate close contacts between residue atoms.

