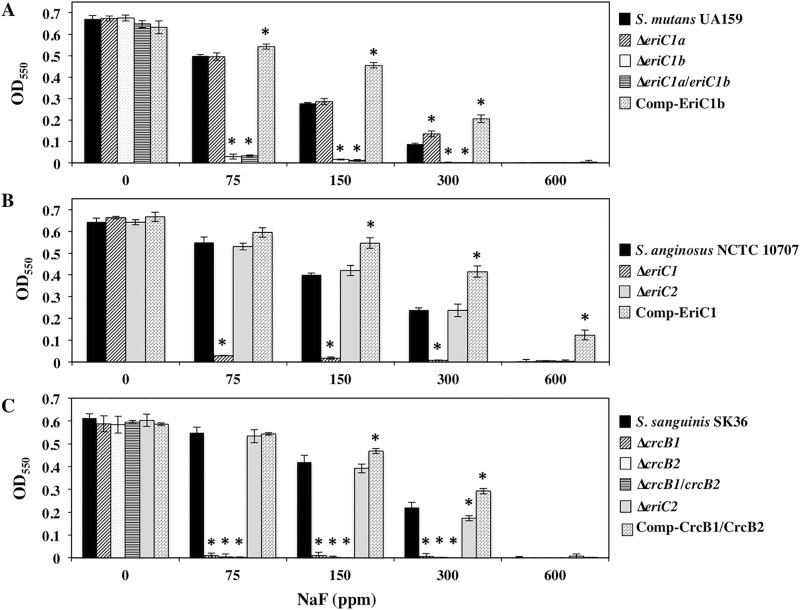
Fig 3.
Growth yields of the parent strains, eriC or crcB deletion mutants, and complemented strains in S. mutans (A), S. anginosus (B), and S. sanguinis (C) at various NaF concentrations. The y-axis represents the OD550 after incubation for 16 h. Data represent the mean standard deviations of three independent experiments. *, significant differences against the OD550 value of the wild-type strain within the same NaF concentration.

