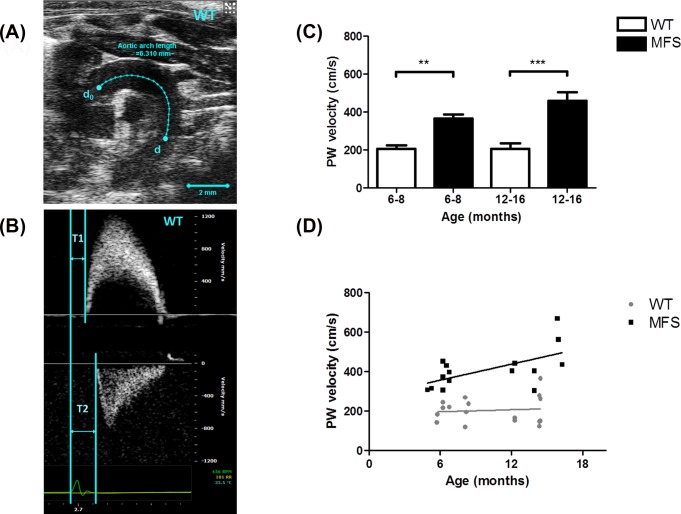
Fig 2. Pulse wave velocity (PWV) of aortic arch.
(A) B-mode view of aortic arch of a 6-month wild type (WT) mouse. The distance between the ascending and descending aorta pulse wave Doppler recordings is indicated by the blue line (d0 to d). Scale bars, 2 mm. (B) Pulse wave Doppler tracing of the ascending (upper panel) and descending aorta (lower panel). The X-axis represents time (ms) and Y-axis represents blood flow velocity (mm/s). T1 is measured from the beginning of the QRS wave on the ECG to the beginning of the ascending aortic peak velocity and T2 is the beginning of the QRS wave on the ECG to the beginning of the descending aortic peak velocity. Pulse wave velocity was calculated using the distance between d0 and d in the aortic arch divided by the transit time (i.e. [d-d0] / [T2-T1]). (C) Aortic PWV of WT and MFS mice from two age groups (6–8 months and 12–16 months group). PWV was significantly increased in 6–8 months MFS mice compared to WT (p = 0.003) and in 12–16 months MFS mice compared to WT (p< 0.001), respectively. (D) Correlations between age (x-axis) and PWV (y-axis) of WT (●) and MFS (■) mice. PWV in MFS mice was directly proportional to age (R-squared = 0.356, p = 0.02), but not in WT mice. ** indicates p< 0.01, *** indicates p< 0.001. (n = 8)

