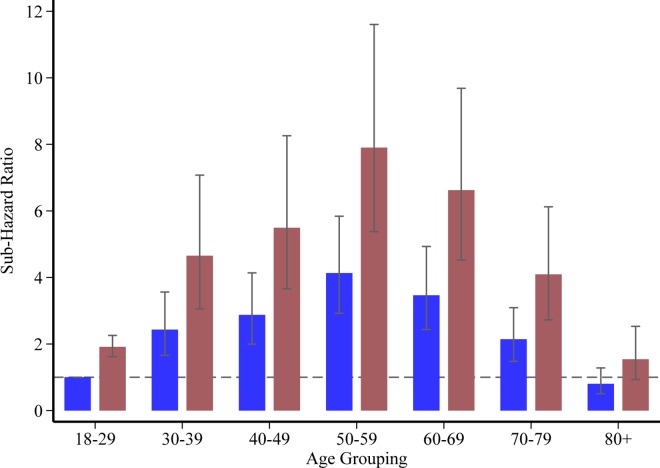
Fig 3. Sub-hazard ratios for the risk of type 2 diabetes by glycemic category and age group.
Control group = blue bars; stress induced hyperglycemia = red bars. Age is grouped approximately into deciles with normoglycemia and age 18–29 years as the base reference; Data are sub-hazard ratios ± 95% confidence intervals.

