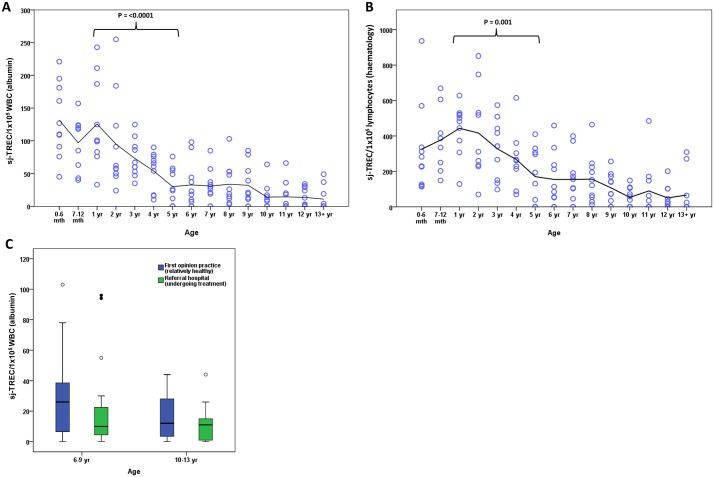
Fig 1. An age associated decline in sj-TREC in Labrador retriever dogs.
Sj-TREC values were determined in blood samples (n = 10 per age category; n = 150 total) from Labrador retriever dogs by qPCR and normalised to either (A) white blood cell numbers as calculated by albumin qPCR, or (B) lymphocyte counts from haematological analysis. Each dog is represented by a circle within their age group. A trend line is shown at the mean for each age group. P values were calculated using the Mann Whitney U test. (C) Box and whisker plots are shown to illustrate sj-TREC values grouped according to whether the dogs were undergoing treatment at a veterinary referral hospital or being sampled as part of routine health monitoring in first opinion practices. The horizontal line in each box represents the median, boxes represent the 25th to 75th percentile and whiskers the highest and lowest values which are not outliers. Outliers are represented by open circles and extreme outliers are represented by filled circles.

