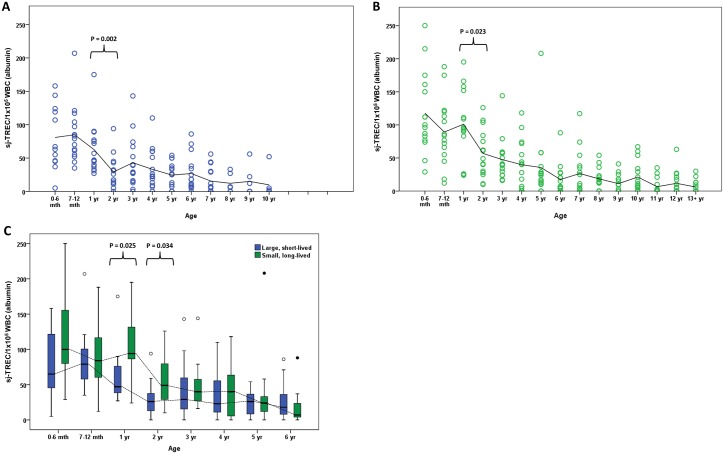
Fig 3. The age associated decline in sj-TREC values differs in short-lived dog breeds compared with long-lived dog breeds.
Sj-TREC values were determined by qPCR, using gDNA samples from (A) large, short lived breeds (n = 150) and (B) small, long-lived breeds (n = 225), and normalised to white blood cell numbers, calculated by qPCR for albumin. Each dog is represented by a circle within their age group. A trend line is shown at the mean for each age group. P values were calculated using the Mann Whitney U test. (C) Box and whisker plots are shown to illustrate sj-TREC data from dogs aged 6 years old and under grouped according to age (n = 15 per age group). The horizontal line in each box represents the median, boxes represent the 25th to 75th percentile and whiskers the highest and lowest values which are not outliers. A trend line is shown at the median for each group. Outliers are represented by open circles and extreme outliers are represented by filled circles. P values were calculated using Mann Whitney U tests.

