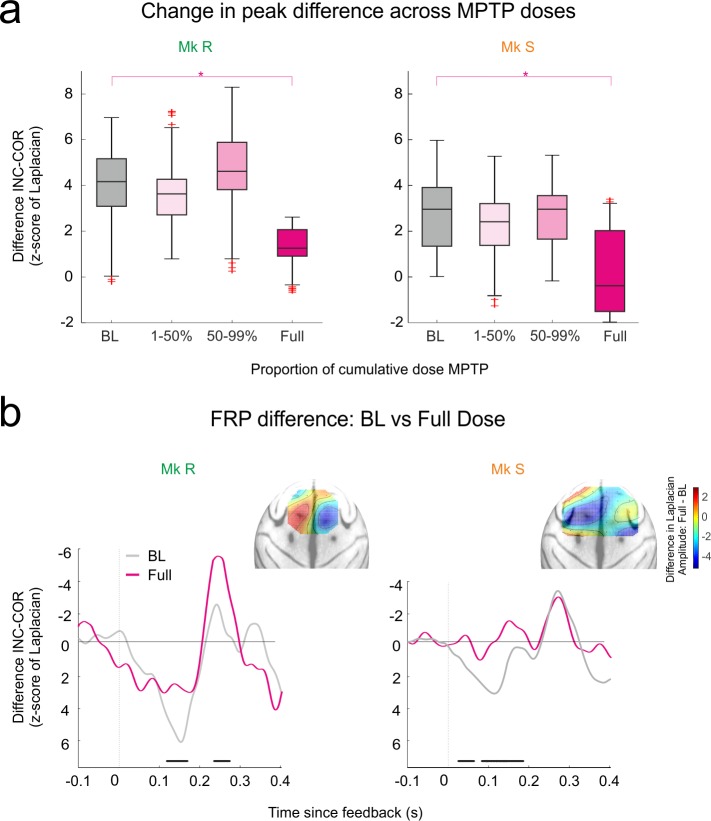
Fig 4. FRPs in MPTP period.
MPTP full dose diminishes the capacity of FRPs to distinguish feedback. A. Evolution of the difference peak (INC-COR) of FRPs during the MPTP period. Significant difference emerges at full dose only in both cases. B. Comparison of the FRP difference wave (INC-COR) between BL and Full Dose. Black bars: permutation test p < 0.01 between control and full dose. Insets show the anatomical distribution of the difference in the FRP difference wave (full dose—BL), with projection using the surface Laplacian. The main region of change (reduction of difference amplitude in blue) matches the location of the peak differences in BL (see Fig 2B).

