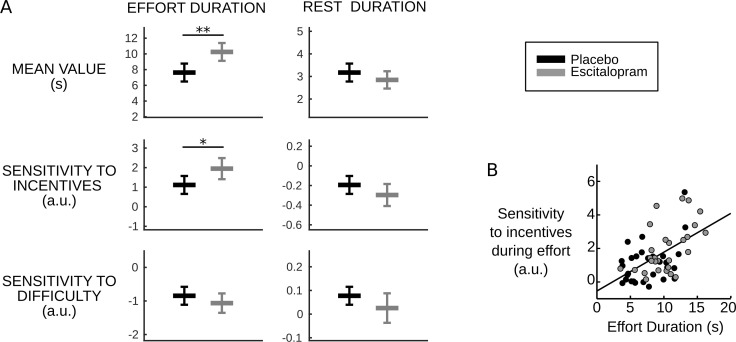
Figure 3. Behavioral results.
(A) Plots show inter-subject means and Student's 95% confidence intervals obtained from linear regression.Regression coefficients were averaged over visits at the subject level. To facilitate visual comparison, scales and offsets were adjusted so that mean and s.e.m. are visually equal across plots in the placebo group. Statistical significance corresponds to ANOVAs including treatment group (escitalopram vs. placebo) as a between-subject factor and treatment phase as a within-subject factor (initial, intermediate or late); *p<0.05, **p<0.005. (B) As predicted by the cost-evidence accumulation model, effort duration and its sensitivity to incentive level are correlated across subjects (one dot corresponds to one subject; values were averaged across visits for each subject). The line shows the linear regression fit obtained when pooling the two treatment groups (ρ56=0.55, p<10–5).
DOI: http://dx.doi.org/10.7554/eLife.17282.010

