. 2016 Nov 8;5:e16764. doi: 10.7554/eLife.16764

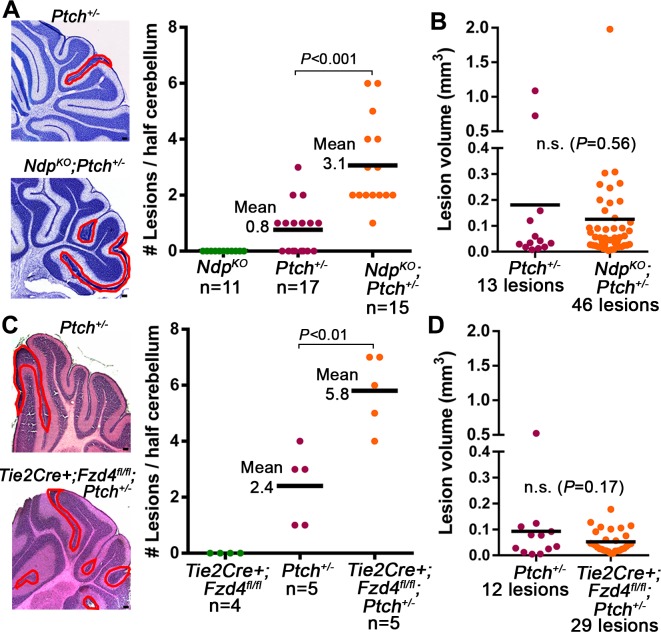
Figure 4. Loss of Norrin/Fzd4 signalling increases lesion formation in P14 Ptch+/− cerebella.

(A) Quantification of lesions from serial sections of cresyl violet stained P14 cerebella from NdpKO, Ptch+/− and NdpKO;Ptch+/− mice. Example lesions are outlined in red, and n indicates the number of mice examined. (B) Quantification of lesion volumes from the lesions in A. (C) Quantification of lesions from serial sections of hematoxylin and eosin (H and E) stained P14 cerebella from Tie2Cre+;Fzd4fl/fl, Ptch+/−, and Tie2Cre+;Fzd4fl/fl;Ptch+/− mice. Example lesions are outline in red, and n indicates number of mice examined. (D) Quantification of lesion volumes from the lesions in C. Means are denoted by black horizontal lines on graphs. Scale bars, 100 µm. See also Figure 4—figure supplement 1.

DOI: http://dx.doi.org/10.7554/eLife.16764.006

Figure 4.

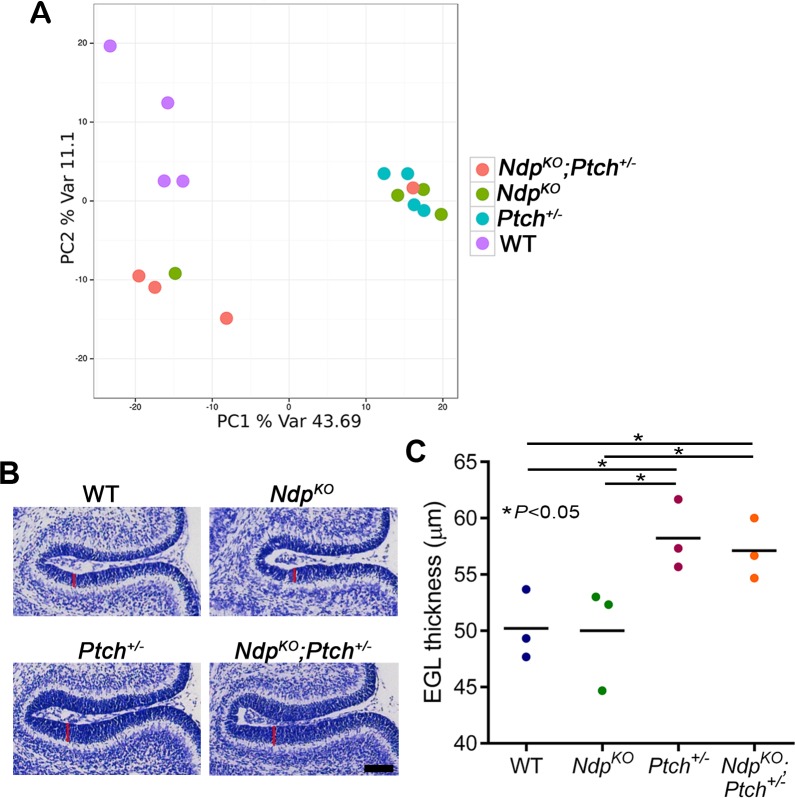
Figure 4—figure supplement 1. Loss of Norrin signalling in Ptch+/− mice does not promote general EGL overgrowth or significant changes in GNP gene expression profile .

Figure 4—figure supplement 1.

(A) Principal component analysis following genome-wide expression array profiling of acutely isolated WT (wild-type), Ptch+/−, NdpKO and NdpKO;Ptch+/− GNPs (n = 4 animals per group) does not reveal clear separation of mutant GNPs. (B,C) Measurements from sections in equivalent cerebellar regions of P6 WT, Ptch+/−, NdpKO and NdpKO;Ptch+/− GNPs (n = 3 in each group) show that loss of Ndp does not increase EGL thickness in otherwise WT mice, or in Ptch+/− mice which exhibit an already thickened EGL. Vertical red lines in B denote EGL thickness. Means are denoted by black horizontal lines on the graph. Scale bar, 100 µm.