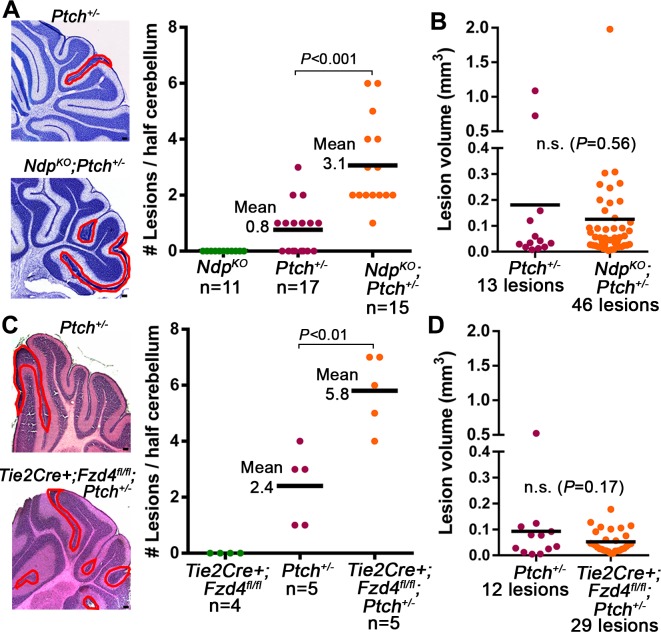
Figure 4. Loss of Norrin/Fzd4 signalling increases lesion formation in P14 Ptch+/− cerebella.
(A) Quantification of lesions from serial sections of cresyl violet stained P14 cerebella from NdpKO, Ptch+/− and NdpKO;Ptch+/− mice. Example lesions are outlined in red, and n indicates the number of mice examined. (B) Quantification of lesion volumes from the lesions in A. (C) Quantification of lesions from serial sections of hematoxylin and eosin (H and E) stained P14 cerebella from Tie2Cre+;Fzd4fl/fl, Ptch+/−, and Tie2Cre+;Fzd4fl/fl;Ptch+/− mice. Example lesions are outline in red, and n indicates number of mice examined. (D) Quantification of lesion volumes from the lesions in C. Means are denoted by black horizontal lines on graphs. Scale bars, 100 µm. See also Figure 4—figure supplement 1.


