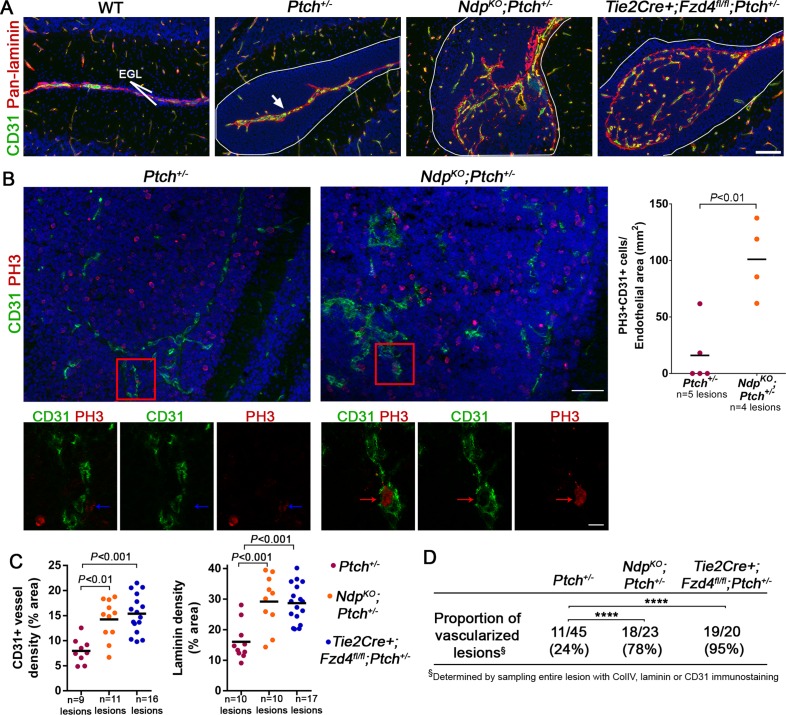
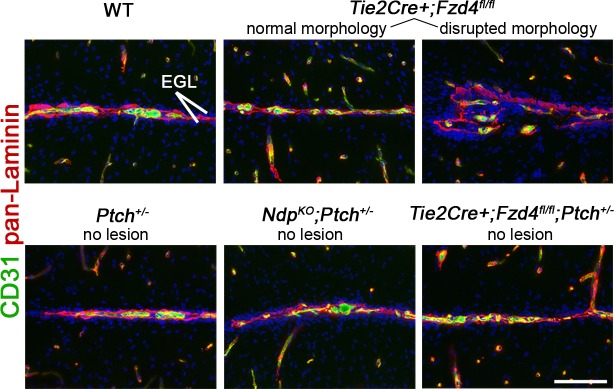
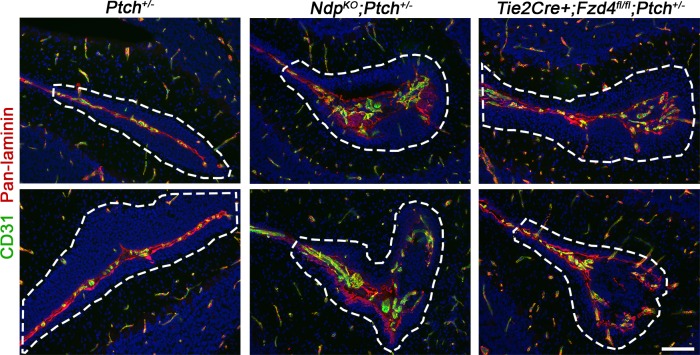
Figure 5. Loss of Norrin/Fzd4 signalling in endothelial cells promotes angiogenic remodeling.
(A) Co-immunostaining for CD31 and pan-laminin, counterstained with Hoescht (blue), on sections of P14 cerebella from the genotypes indicated. Lesions are outlined in white. Arrow on Ptch+/− lesion denotes meningeal blood vessels. Scale bar, 100 µm. (B) Quantification of mitotic endothelial cells in Ptch+/− and NdpKO;Ptch+/− lesions. Top images show co-immunostaining for CD31 and PH3, counterstained with Hoescht (blue), on vascularized P14 lesion sections. Scale bar, 50 µm. Red squares denote areas shown by confocal scans below, where left image depicts the composite maximum intensity projection and the center and right images show individual z-stack slices. Scale bar, 10 µm. Blue arrows denote a PH3+ cell scored as negative for co-localization, whereas red arrows denote a positive co-localization. Graph on right summarizes quantification of double labelled PH3+CD31+ cells per endothelial area. (C) Quantification of CD31+ vessel density and laminin density in lesions of Ptch+/−, NdpKO;Ptch+/− and Tie2Cre+;Fzd4fl/fl;Ptch+/−. Number of lesions (n) examined is indicated on each graph in B and C, and means are denoted by black horizontal lines. (D) Summary of the proportion of vascularized lesions from each genotype. ****p<0.0001. See also Figure 5—figure supplement 1 and 2.


