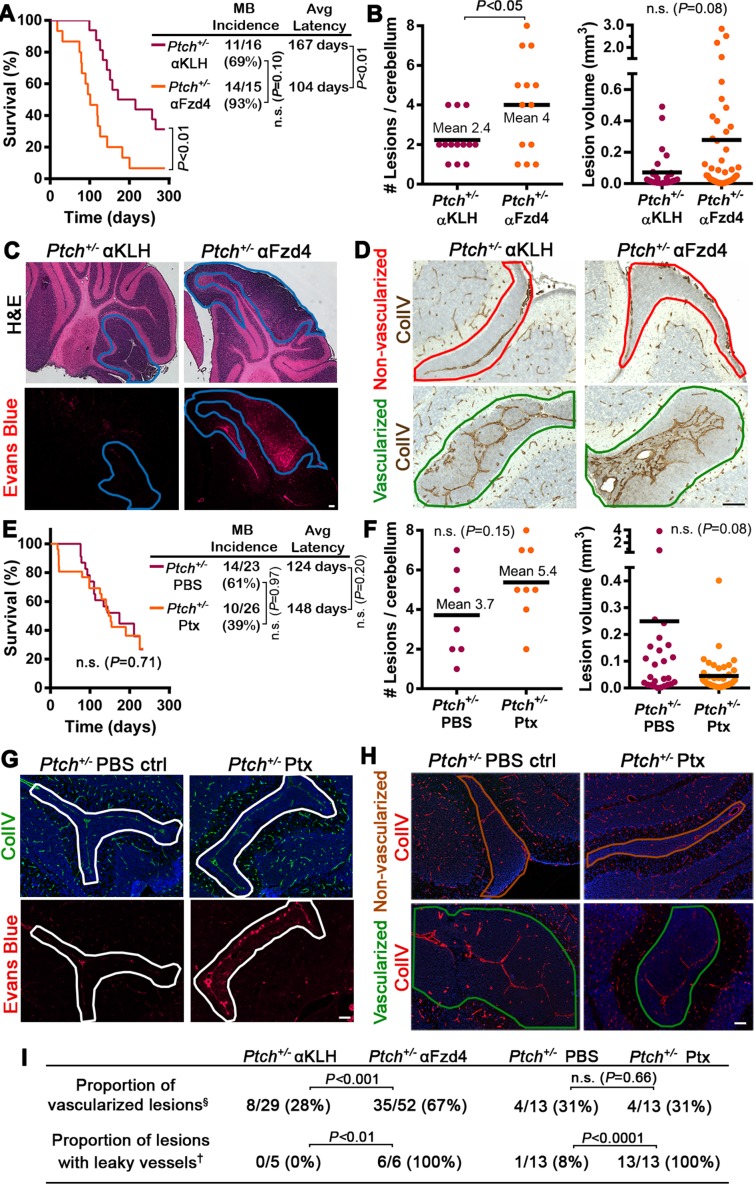
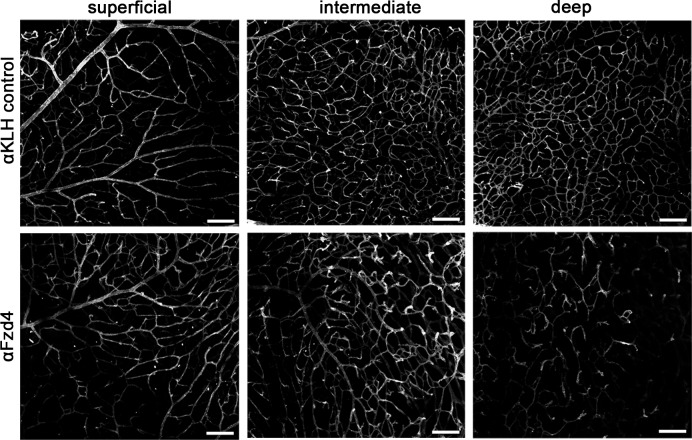
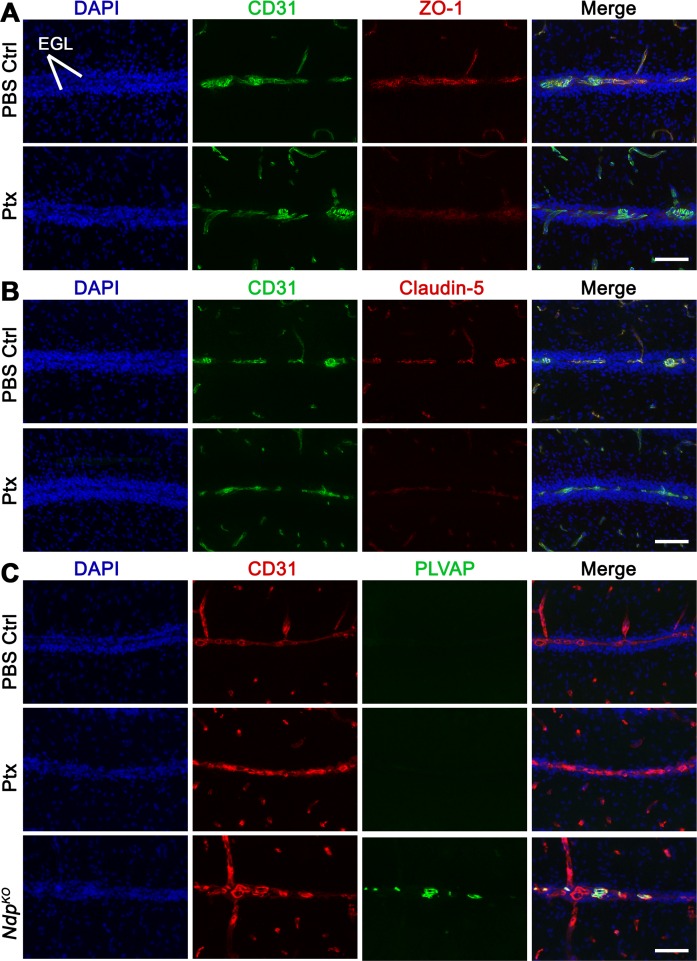
Figure 7. Acute disruption of Fzd4 promotes the conversion to a pro-tumor stroma .
(A) Kaplan-Meier survival curve comparing Ptch+/− mice treated with αFzd4 or αKLH isotype matched control antibodies at P7 and P16. All mice died with confirmed MB. Sample sizes, MB incidence and average latency are indicated at right. (B) Quantification of lesion number and volume from P14 cerebella of Ptch+/− mice treated at P7 with αFzd4 (n = 13 mice, 52 lesions total) or αKLH (n = 13 mice, 29 lesions total). Means are denoted by black horizontal lines on graphs. (C) Lesion images from Ptch+/− mice treated at P7 with αKLH (n = 5 lesions) or αFzd4 (n = 6 lesions). Mice were injected with Evans Blue dye prior to sacrifice and sampled by H and E staining followed by Evans Blue visualization as red fluorescence on adjacent sections. Lesions outlined in blue. (D) Lesion images from Ptch+/− mice treated at P7 with αKLH (n = 29 lesions) or αFzd4 (n = 52 lesions), immunostained for ColIV and counterstained with hematoxylin, to quantify the proportions of non-vascularized (outlined in red) and vascularized (outlined in green) lesions in each group. (E) Kaplan-Meier survival curve comparing Ptch+/− mice treated with Ptx or PBS vehicle control at P7, P9, P11 and P13. The sudden drop in Ptx-treated survival is a result of four animals dying from brain hemorrhages or seizures. Three other Ptx-treated animals were euthanized due to malocclusion or unknown causes, while all other mice in both groups died with confirmed MB. Sample sizes, MB incidence and average latency are indicated at the right. (F) Quantification of lesion number and volume from P14 cerebella of Ptch+/− mice treated as above with Ptx (n = 8 mice, 43 lesions total) or PBS (n = 7 mice, 26 lesions total). (G) Lesion images from Ptch+/− mice treated with Ptx (n = 13 lesions) or PBS (n = 13 lesions) as above. Mice were injected with Evans Blue dye prior to sacrifice and sampled by ColIV immunostaining followed by Evans Blue visualization as red fluorescence on adjacent sections. Lesions outlined in white. (H) Lesion images from Ptch+/− mice treated with Ptx (n = 13 lesions) or PBS (n = 13 lesions) as above, immunostained for ColIV to quantify the proportions of non-vascularized (outlined in brown) and vascularized (outlined in green) lesions in each group. (I) Summary of Ptch+/− lesion number and vessel parameters upon treatment with αFzd4 or Ptx. Scale bars, 100 µm. See also Figure 7—figure supplement 1 and 2.


