
Fig. 7.
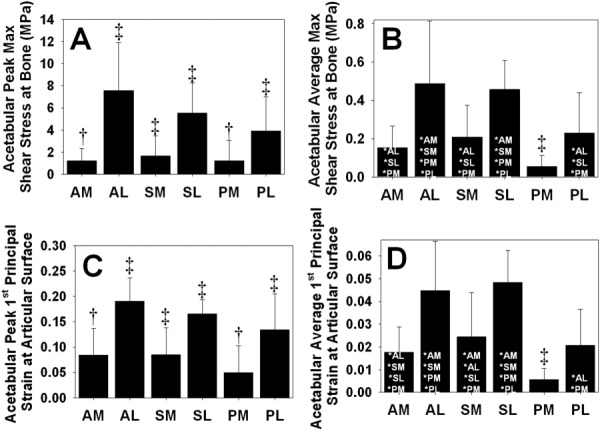
E1 and τmax in six anatomical regions on the acetabulum the EFD models. (a) Peak τmax at the osteochondral interface. (b) Average τmax at the osteochondral interface. (c) Peak E1 at the articular surface. (d) Average E1 at the articular surface. ‡ indicates p ≤ 0.05 against all other regions. † indicates p ≤ 0.05 against all other regions except the one with the same symbol in the same panel. * indicates p ≤ 0.05 against the listed region. Error bars = standard deviation. There were distinct regional differences in E1 and τmax, with the largest values occurring the AL region and the smallest values occurring in the PM region.