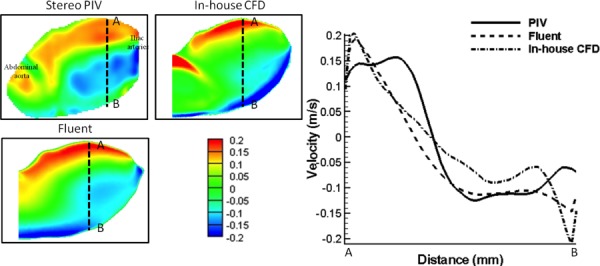
Fig. 7.

(a) Out-of-plane velocity data comparison of patient-specific AAA model without ILT using stereoscopic PIV, Fluent, and in-house CFD methods. Left panel: Out-of-plane velocity contour maps; right panel: quantitative velocity profile comparison. Data were extracted from each A-B line (50 mm) of contour plots (left panel). Correlation coefficients between stereoscopic PIV and Fluent, stereoscopic PIV and in-house CFD, and Fluent and in-house CFD are 0.92, 0.85, and 0.96, respectively. Unit of the color bar: m/s.
