
Fig. 3.
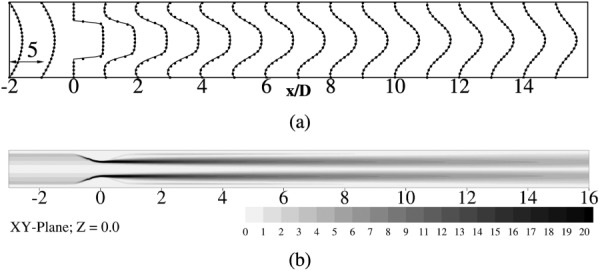
(a) Normalized mean axial velocity profiles () at indicated locations along the axial direction. Solid lines correspond to WenoHemo simulation, solid dots indicate DNS [9]. Scale represents 1 axial unit (x/D) equals 5 velocity units . (b) Contours of normalized vorticity magnitude () on XY-plane at Z = 0.