
Fig. 5.
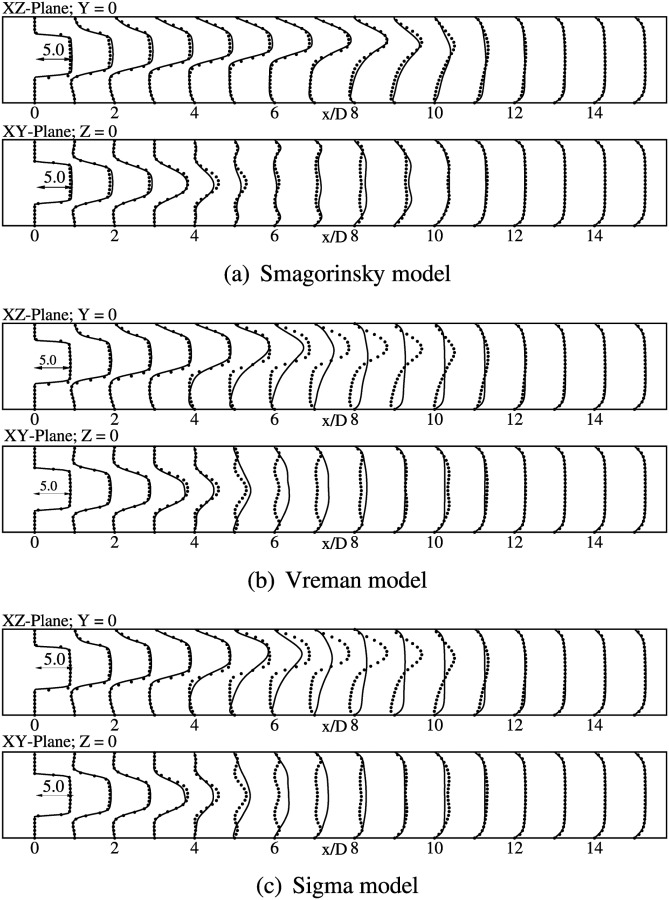
Normalized mean axial velocity () profiles at indicated locations. Lines show present simulations using WenoHemo and dots indicate the DNS result.
Official websites use .gov
A
.gov website belongs to an official
government organization in the United States.
Secure .gov websites use HTTPS
A lock (
) or https:// means you've safely
connected to the .gov website. Share sensitive
information only on official, secure websites.
Normalized mean axial velocity () profiles at indicated locations. Lines show present simulations using WenoHemo and dots indicate the DNS result.