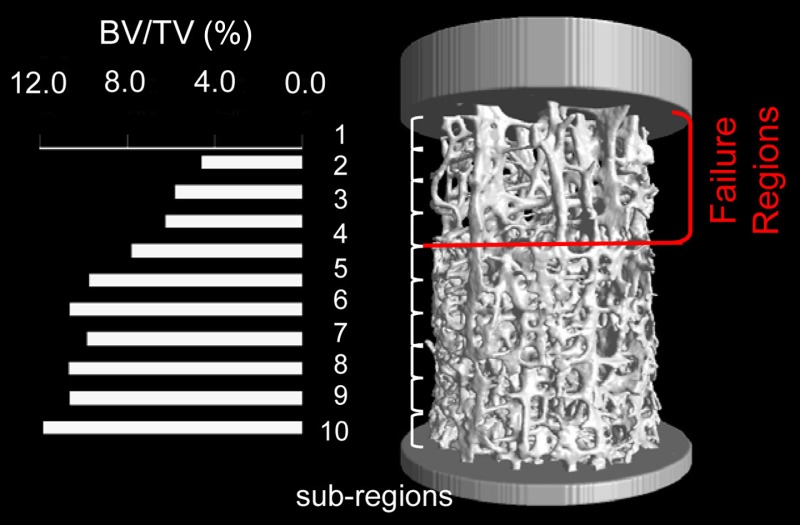
Fig. 9.

Failure occurs at subregions with the lowest BV/TV values. Subregions number 1, 2, 3, and 4 with the lowest BV/TV values here coincide with the four regions that fail based on the visual data provided by the time-lapsed mechanical testing. (From Reference 167 with permission.)
