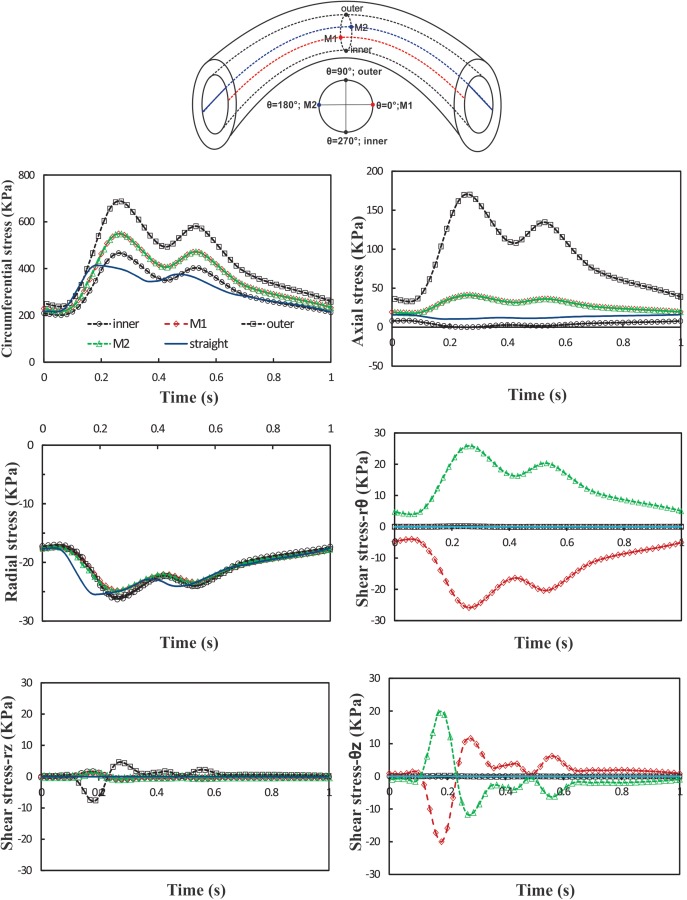
Fig. 7.

Schematics: definition of inner, outer, M1, M2 points, and axial curves which are equally distributed along the circumference of vessel lumen. Graphs: temporal variation of normal and shear stresses at the inner, outer, M1 and M2 points of artery under pulsatile flow with Q m = 160 ml/min, P m = 130 mm Hg, and SR = 1.3. The results are compared with a control straight artery under the same conditions. SR = stretch ratio; Q m = mean flow rate; and P m = mean pressure.
